Comparison Of System Monitoring Programs
There is a fairly huge number of both GUI and console programs for GNU/Linux that do process monitoring, bandwidth monitoring, GPU monitoring and monitoring of other system resources. Some can monitor several areas, some are limited to one. Most of the GNU/Linux desktop environments come with a system monitoring application specifically designed for it. None of the graphical programs are very complete compared to built-in tools that come with proprietary operating systems. Here is an overview of most of the free software alternatives and their strengths and weaknesses.
Windows "Task Manager" Does It Right[edit]
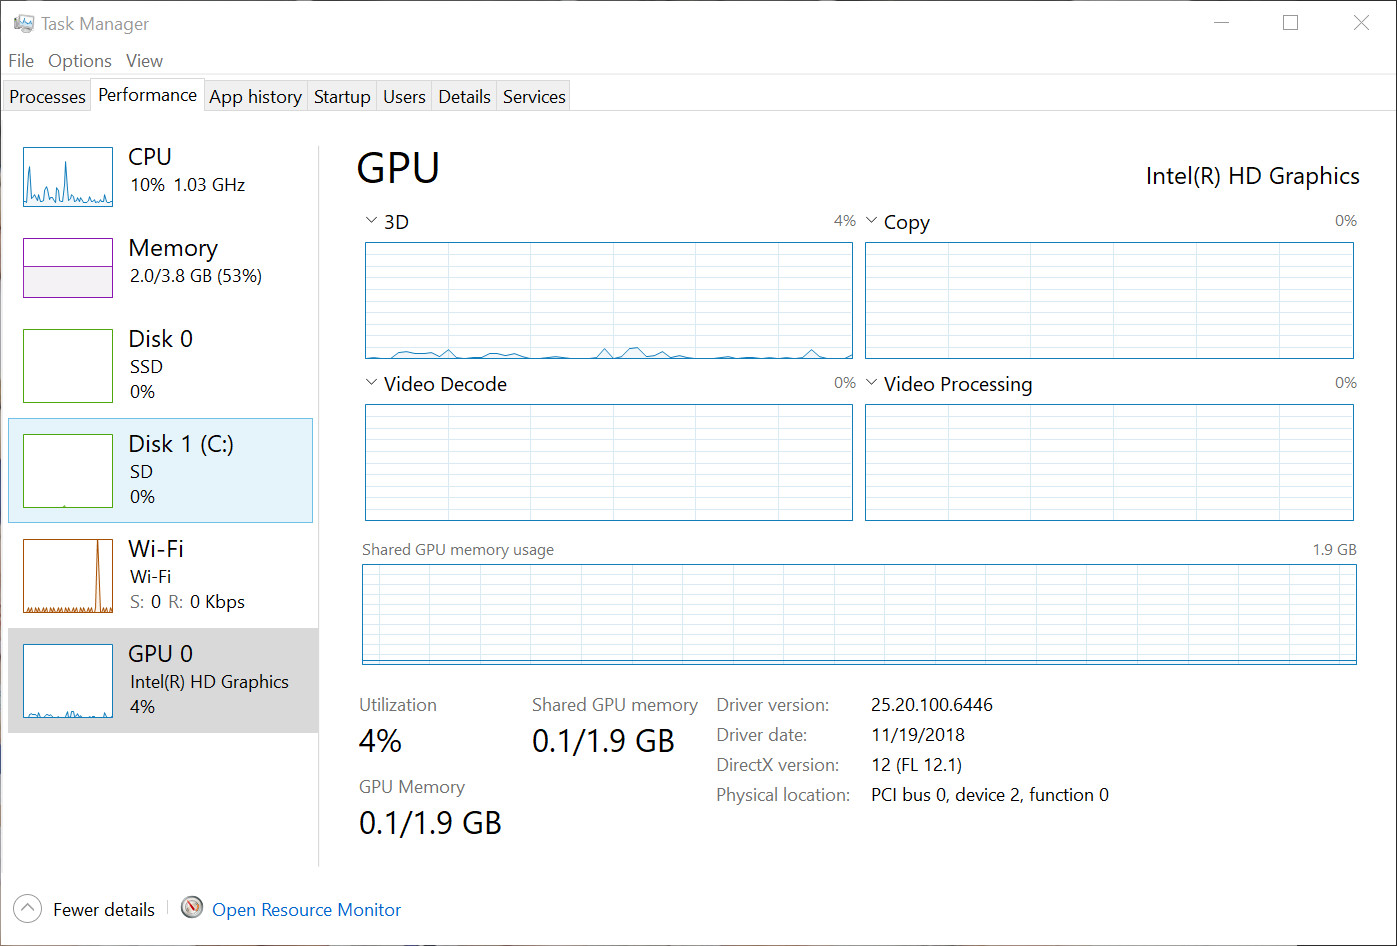
The windows task manager showing various information about the systems GPU.
The Windows Task Manager is not free software and it does not work on GNU/Linux systems, it is a Windows-only application. We include it here because it is a good example of how a system monitoring program could and should look, feel and behave. It has more features than any single comparable GNU/Linux application and it is easier to use.
- Windows-task-manager-memory.jpg
Windows Task Manager showing memory information
Windows Task Manager showing CPU load
Microsoft Windows task manager showing running processes.


The Windows Task Manager has easily accessible graphs showing CPU use, memory use, disk use, network use, and graphics card utilization. There's also tabs for processes, performance (where the graphs can be found), application history, startup programs, users, "details" and system services. None of the comparable system monitoring programs for GNU/Linux has all of these features. The KDE System Monitor is the only one which comes close but it doesn't show disk I/O unless you either configure it or download a plugin and it can't show any GPU memory or load statistics at all.
GNU/Linux System Monitoring Tools At A Glance[edit]
| Program | Rating | Framework | monitoring abilities | historic graphs | remote system monitoring | ||||||
|---|---|---|---|---|---|---|---|---|---|---|---|
| processes | memory | gpu | disk I/O | network | system services | ||||||
| Windows Task Manager | Windows | ||||||||||
| GNOME System Monitor | GTK/GNOME | ||||||||||
| KDE System Monitor | Qt/KDE | ||||||||||
| Psensor | GTK | ||||||||||
| Xfce Task Manager | GTK/Xfce | ||||||||||
| bmon | |||||||||||
| htop | |||||||||||
| top | |||||||||||
| radeontop | |||||||||||
| ytop | |||||||||||
| Munin | |||||||||||
Graphical Programs[edit]
GNOME System Monitor[edit]

GNOME System Monitor showing a list of system processes.
The GNOME System Monitor lets you see a list of running processes with configurable levels of detail about each process. There is also a nice graph view capable of showing CPU load, memory and swap utilization and total network load.
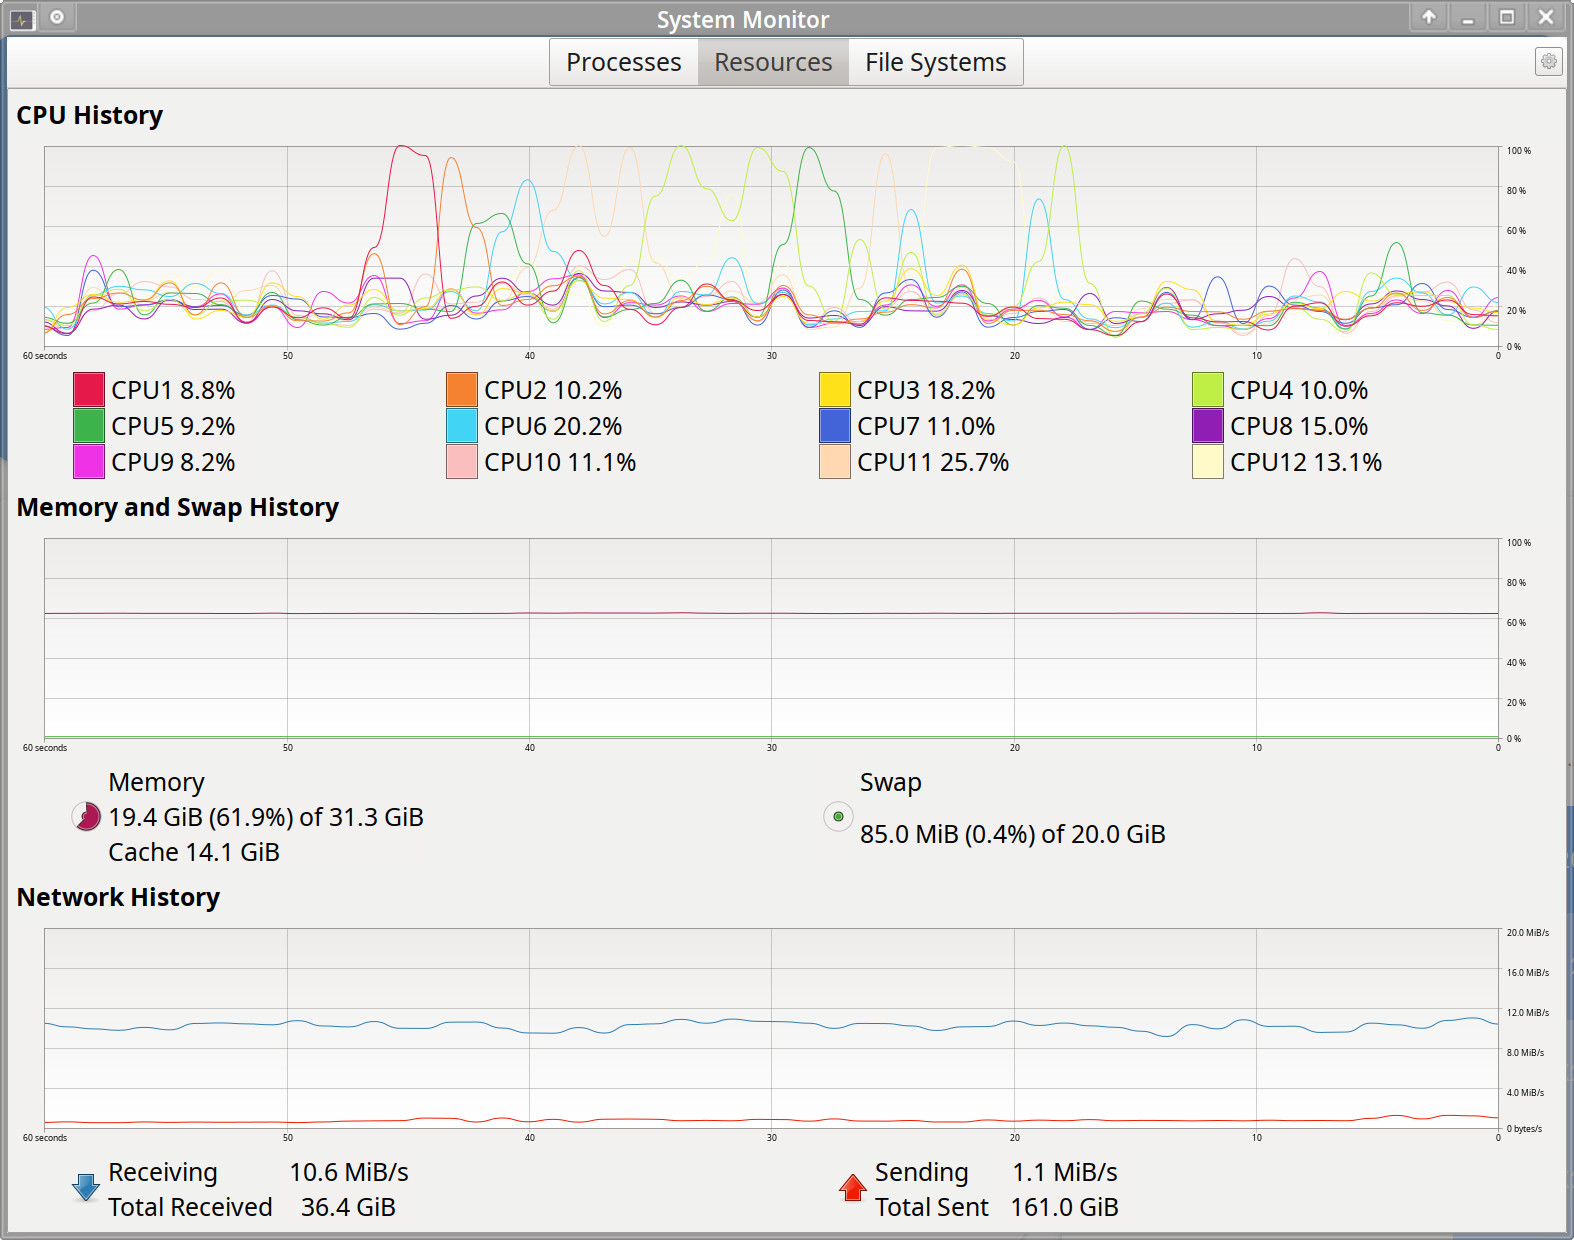
GNOME System Monitor version 3.36.1 showing graphs indicating CPU, memory and network utilization over time.
The graphs are not configurable. There is no support for showing temperatures, disk I/O or graphics card utilization.
- See GNOME System Monitor for additional information about GNOME System Monitor.
KDE System Monitor[edit]

The KDE System Monitor process list with some additional information such as and enabled.
The KDE Plasma desktop environment comes with a simple system monitor called "System Monitor" (ksysgard). It looks like a very simple program as far as system monitoring applications are concerned when you first open it and it is a very simple program out-of-the-box. It is actually a very powerful highly configurable program.
The KDE System Monitor has two default tabs. One embeds the KDE System Activity program that shows you a list of all system processes (binary systemmonitor, part of plasma-workspace). System processes can be viewed as a list or a tree. Processes can be filtered by user processes, all processes or your own processes only. The other tab shows "System load" using graphs that show CPU History, Memory and Swap History and Network History. It does not show disk I/O, system temperatures, GPU load or anything else that it could show.
The two tabs available in the KDE System Monitor are not the only ones you can have. The menu ▸ allows you to download plugins that can make a whole range of other information available in additional tabs. Interesting plugins include System Load and Temps, Hard Disk Totals and Battery Power. There is also a confusing myriad of machine-specific plugins available.
You can also make your own tab views in the KDE System Monitor using a built-in sensor browser. This makes it a potentially very powerful tool. It also makes it less than user-friendly; making your own graph views using its "Sensor Browser" is tiresome and not at all strait forward. And while there are a lot of things you can show in the "Sensor Browser" there are some things you can not make it show. There is no GPU memory or load information available even though modern kernel does provide that kind of information. You can add make graphs showing disk utilization, both total and per-disk, and a lot of other things.
The KDE System Monitor can be used to monitor remote systems as long as ksysguardd (which has a lot of dependencies) is installed on the remote machine.
The KDE System Monitor is overall the most complete and powerful system monitoring utility for GNU/Linux machines yet it does lack the finesse, and quite a few features, the proprietary Microsft Windows Task Manager has.
- See KDE System Monitor for additional information about KDE System Monitor.
Psensor[edit]
Psensor is a small GTK based program for monitoring fan speeds and system temperatures. It provides nice real-time graphs of system sensors and only system sensors. There is no functionality for monitoring anything else.
Xfce Task Manager[edit]
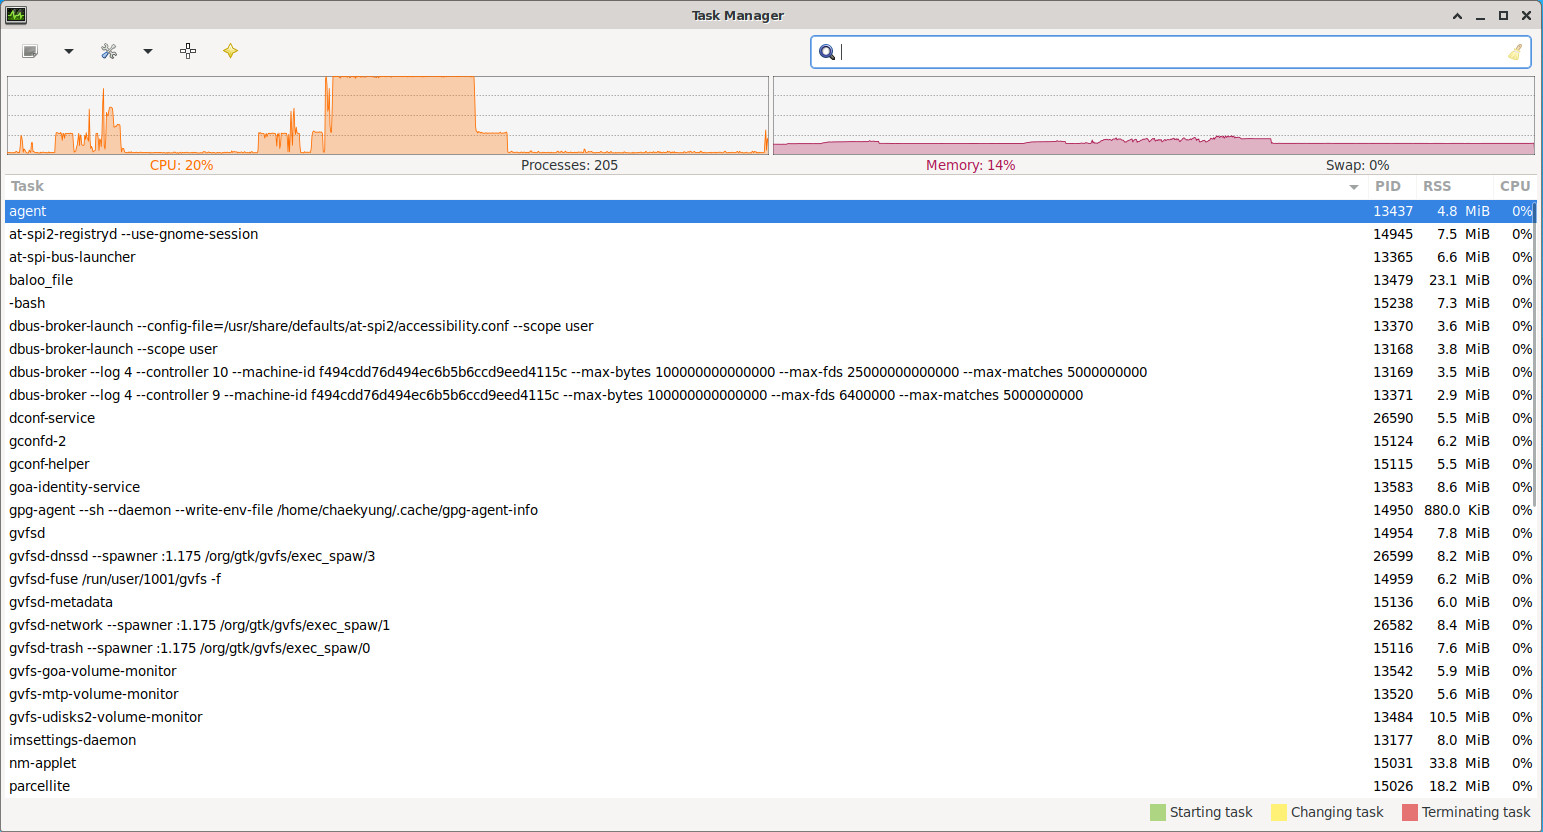
The Xfce Task Manager version 1.2.3 showing some processes.
The Xfce Task Manager is a really simple task manager and system monitor program. It shows you a list of running processes and two graphs showing CPU and memory use and that's it. It is light-weight, installing it does not require many big dependencies beyond GTK. It is also severely limited compared to the graphical KDE System Monitor. It is also limited compared to the terminal-based htop process manager. It comes with Xfce, so you have it if you use Xfce. It does not have any virtues beyond that.
- See Xfce Task Manager for additional information about Xfce Task Manager.
Console Programs[edit]
bandwhich[edit]
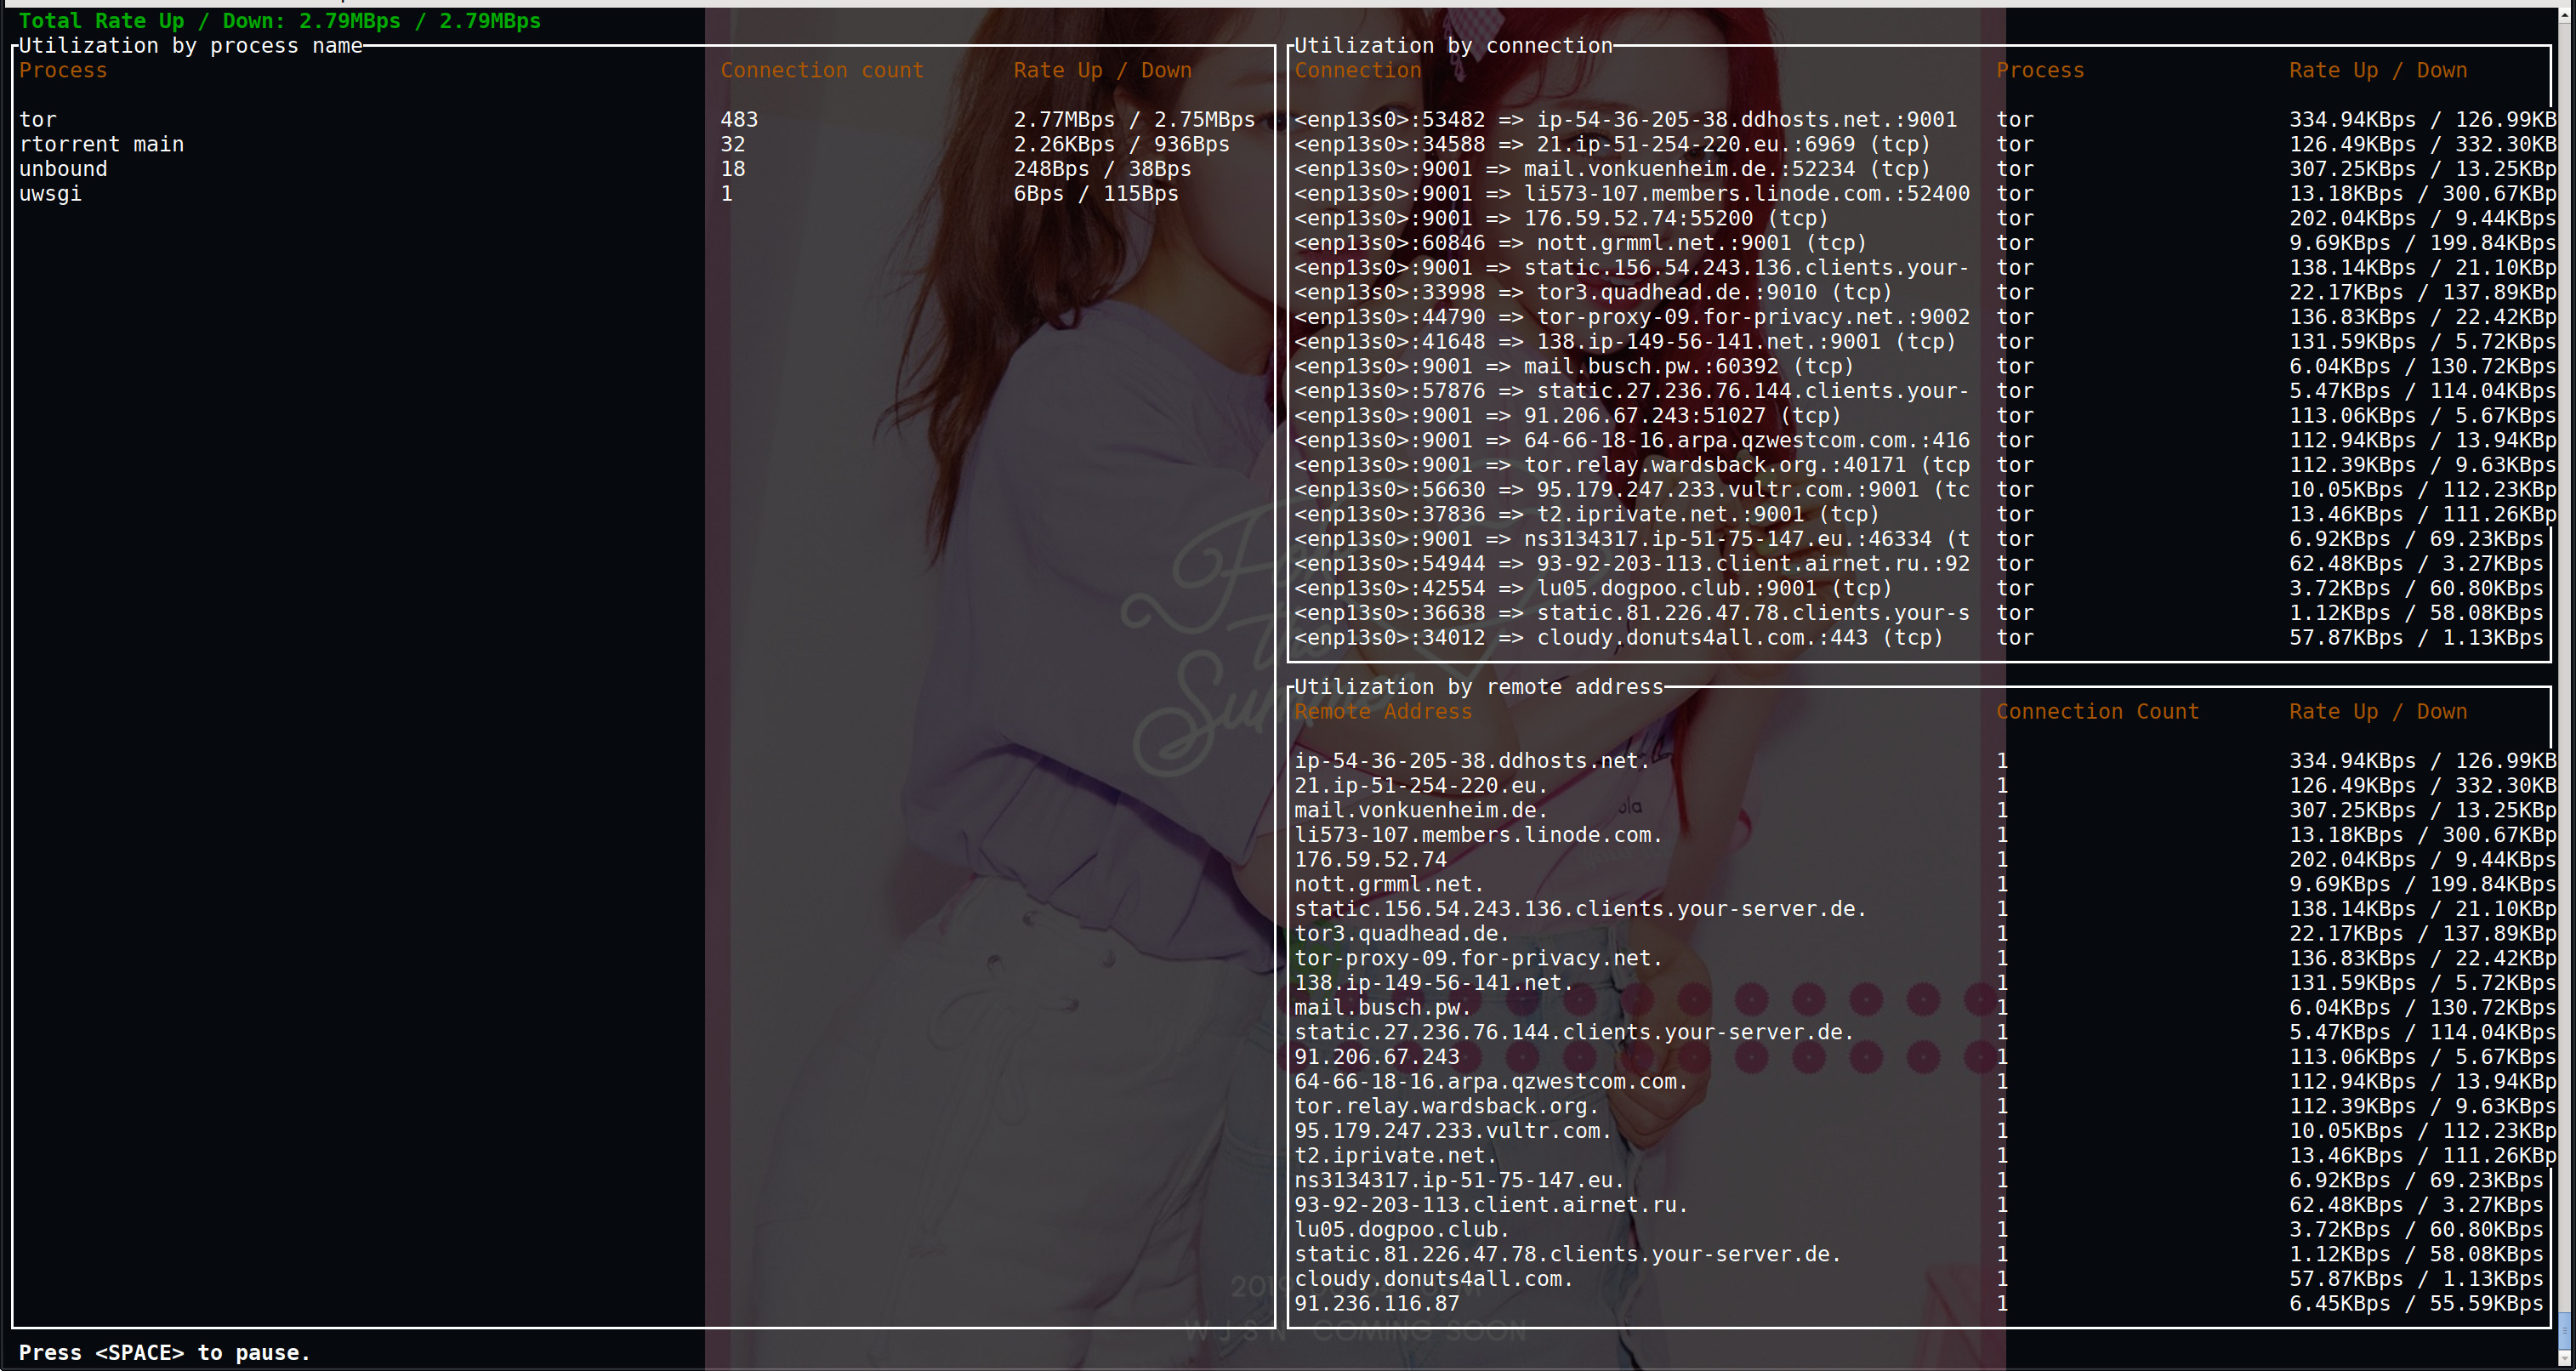
bandwhich v0.10.0.
bandwhich is a console program that allows you to see a machines bandwidth utilization by connection and process. It is not show nice bandwidth graphs, it shows real-time network use with information about what is using the network in a meaningful way.
bmon[edit]
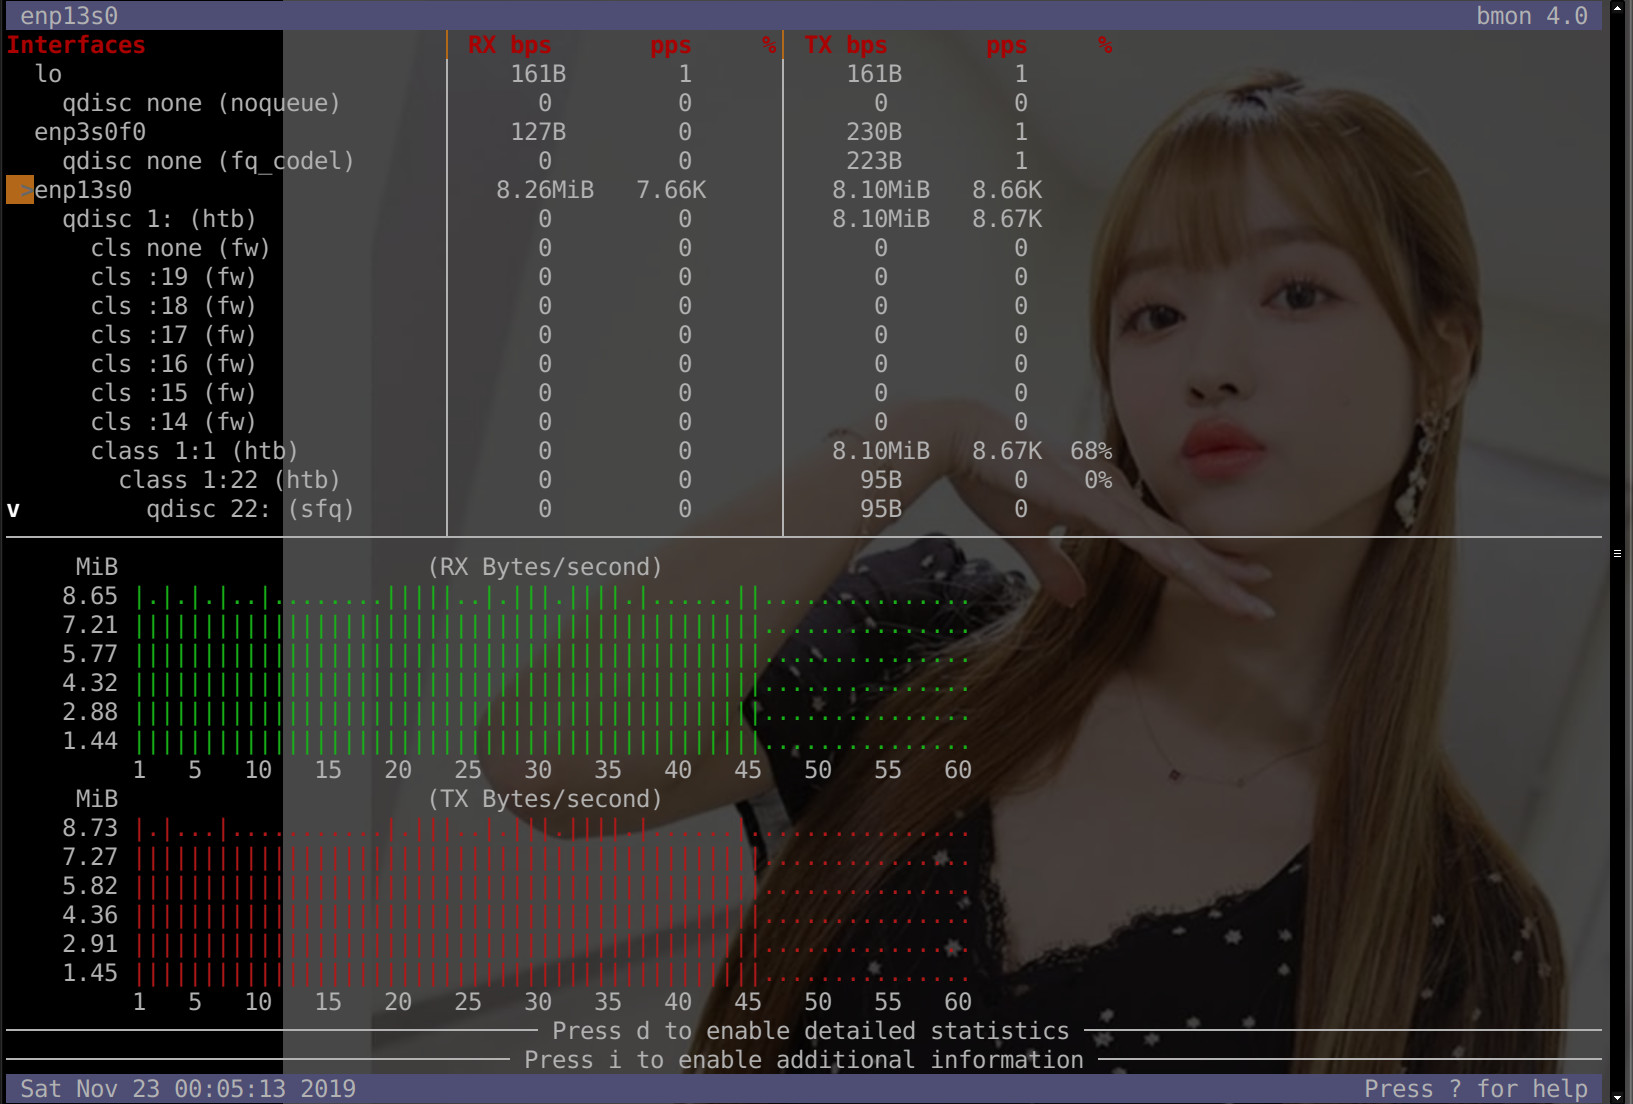
bmon version 4.0.
bmon is a really nice network monitoring utility. It lets you see per-interface network activity in real-time with nice optional graphs.
bmon is very good if you want to see how much a given network interface is sending and receiving. It is not a general-purpose system monitoring tool, it will not give you any information about other system activity.
htop[edit]

htop version 2.2.0 running on a CentOS 7 box.
htop is the best process list monitoring utility for terminals. It shows a process list that can be easily sorted, filtered, searched and shown as a tree. Processes can be killed, re-niced, have its I/O priority changed and more. It is comparable to, and nicer than, top.
htop does not have any system monitoring capabilities beyond showing the process list. It does not have any support for showing network utilization or disk I/O or graphics card utilization or anything beyond process list management.
top[edit]
top is the standard go-to terminal tool for showing a list of running processes on a GNU/Linux system. It is not as nice as htop but it provides most of the same functionality. top has the advantage of guaranteed being there on any GNU/Linux box while htop is typically not unless the system administrator chose to install it.
top is, like htop, a process list viewer and nothing more. It dose not have any means of monitoring disk I/O or network activity or anything else.
radeontop[edit]

Radeontop version 1.2.28 started with radeontop -c
radeontop is a specialized program for showing detailed information, with real-time graphs, about AMD graphics cards. That is what it does and it does that well. It does nothing else, there is no process list or network or disk I/O information. radeontop is a tool made specifically for showing detailed information about AMD graphics chips. It will not do anything for you if you have a Intel or Nvidia graphics card.
ytop[edit]
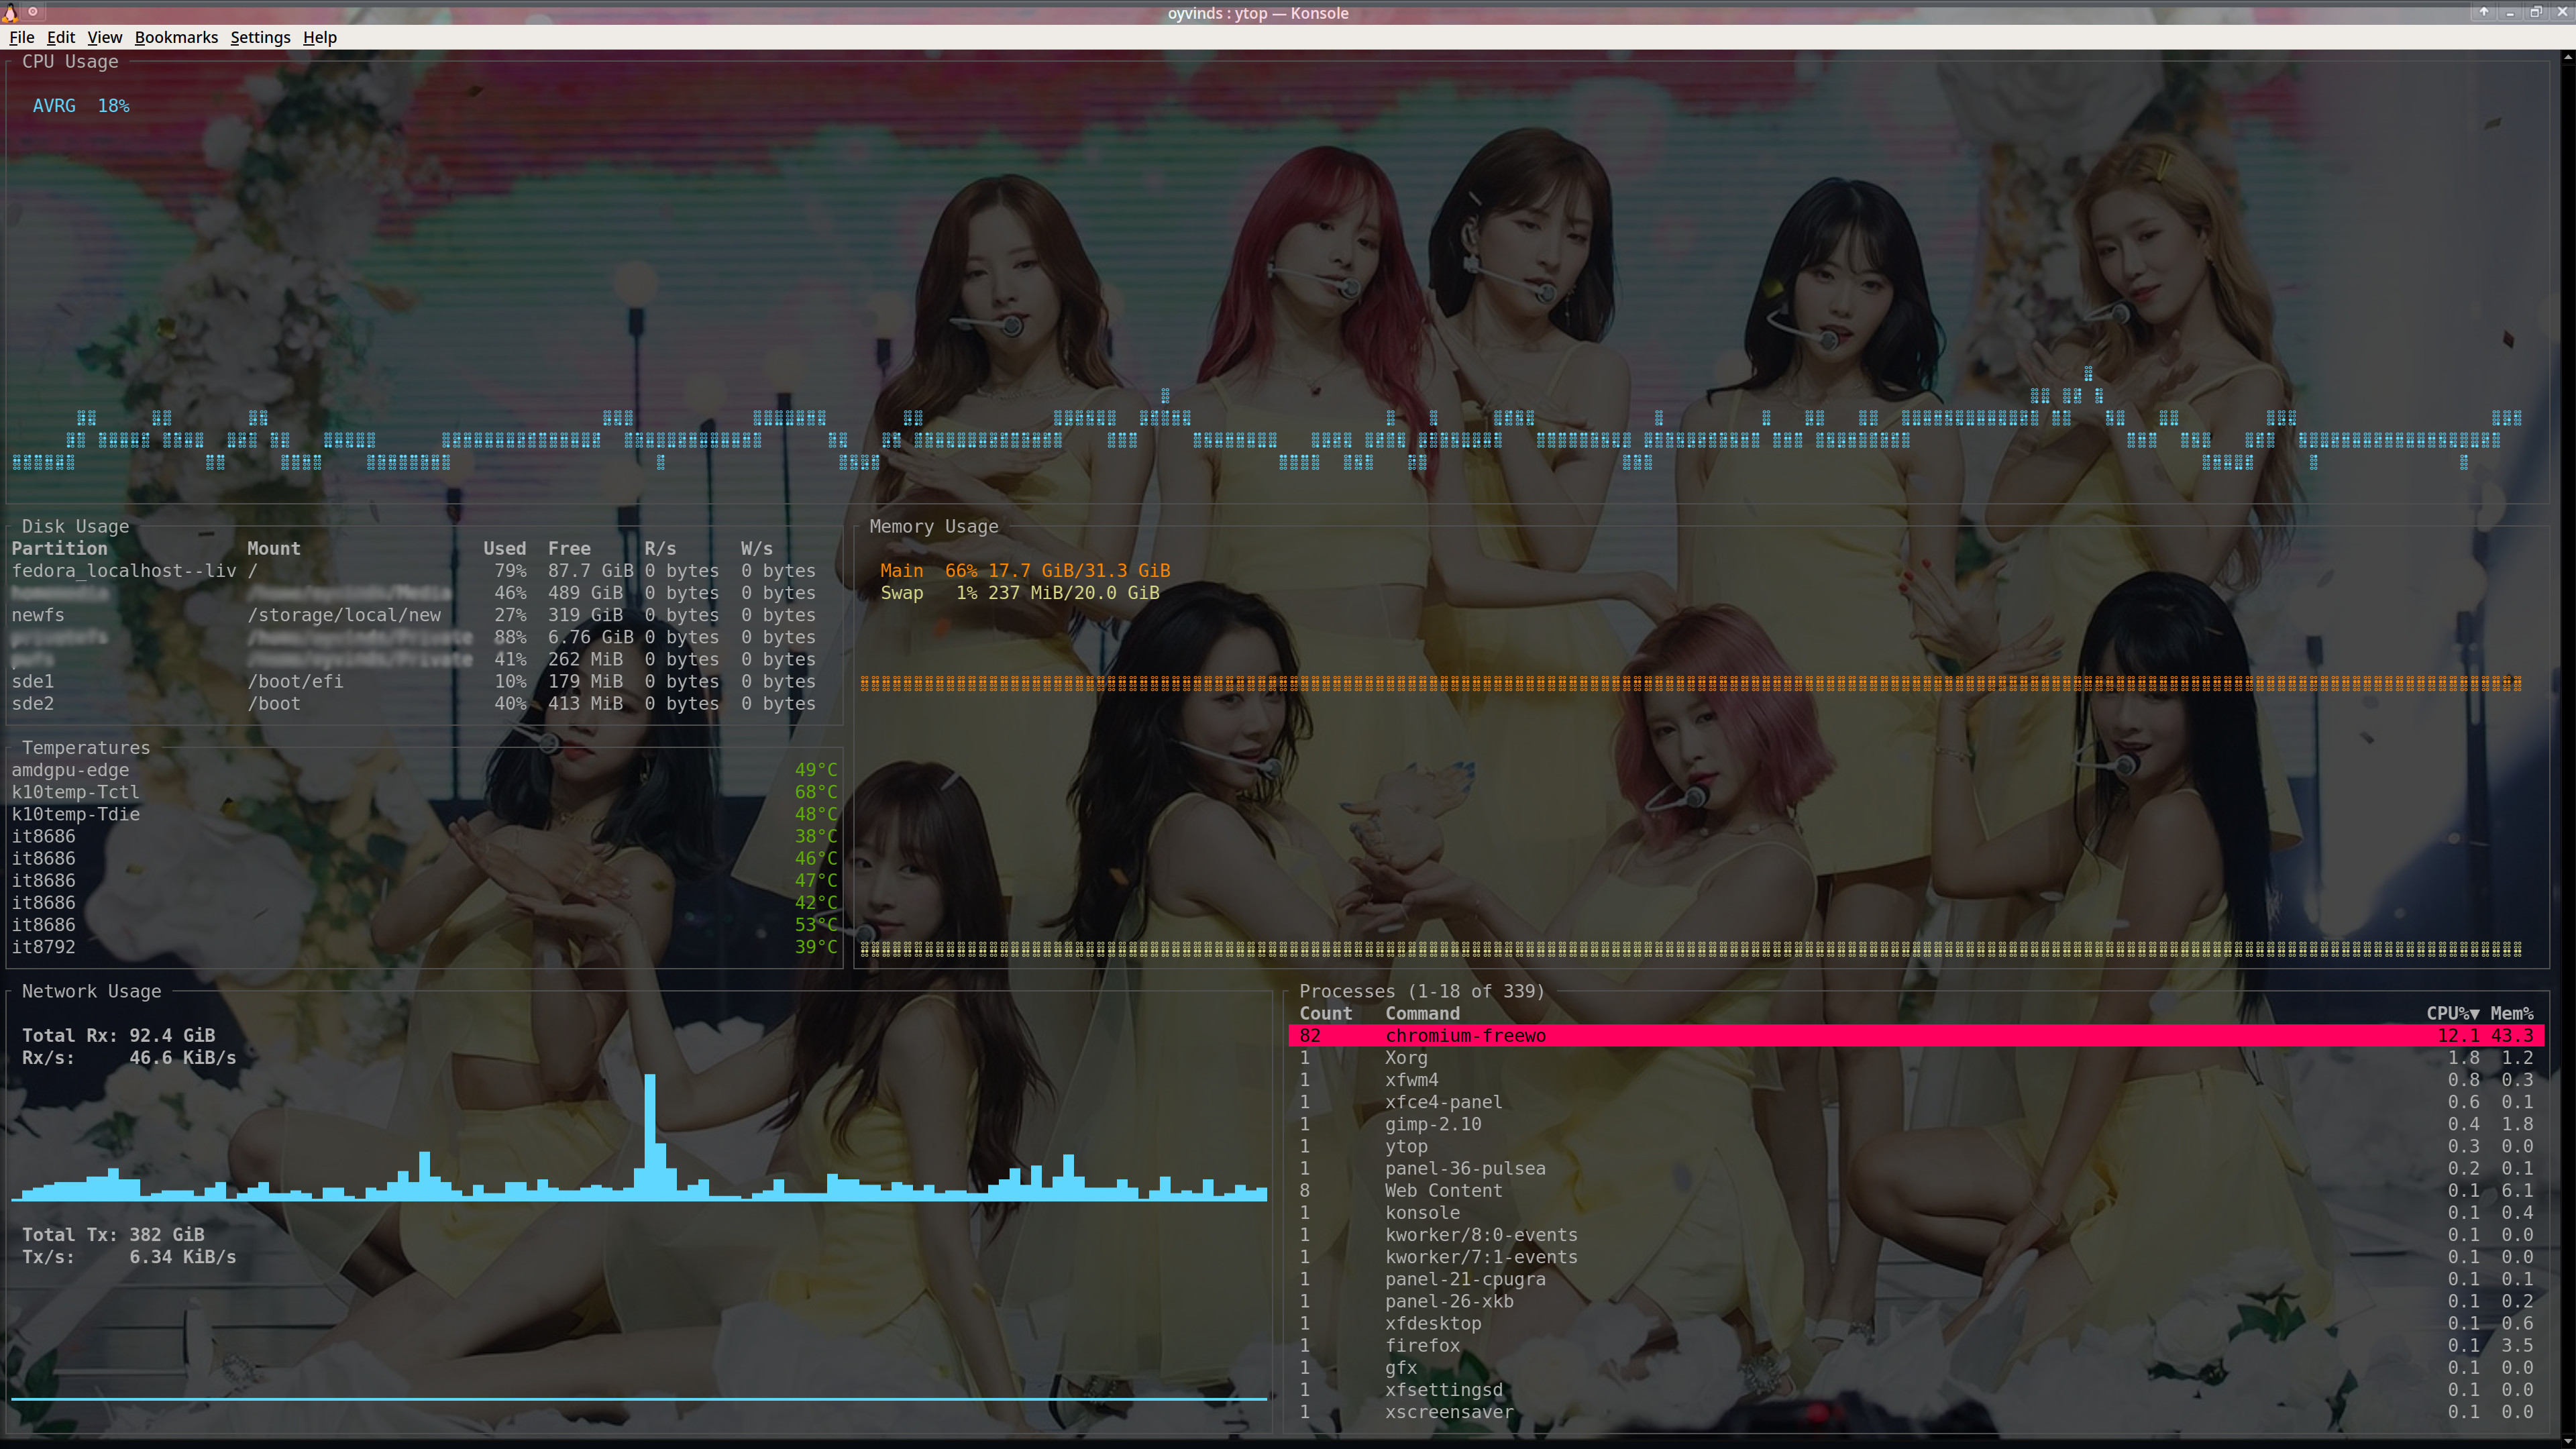
ytop version 0.6.2 with the monokai color scheme.
ytop is a console program with a process list that provides limited functionality, a nice CPU graph that can optionally show per-core utilization, a network bandwidth graph and a memory usage graph. It is not an alternative to htop or top for process management. It is a very nice and handy console program that lets you see what is going on at a glance. Disk I/O and GPU utilization is not supported as of version 0.6.2.
Web-Based Programs[edit]
Munin[edit]
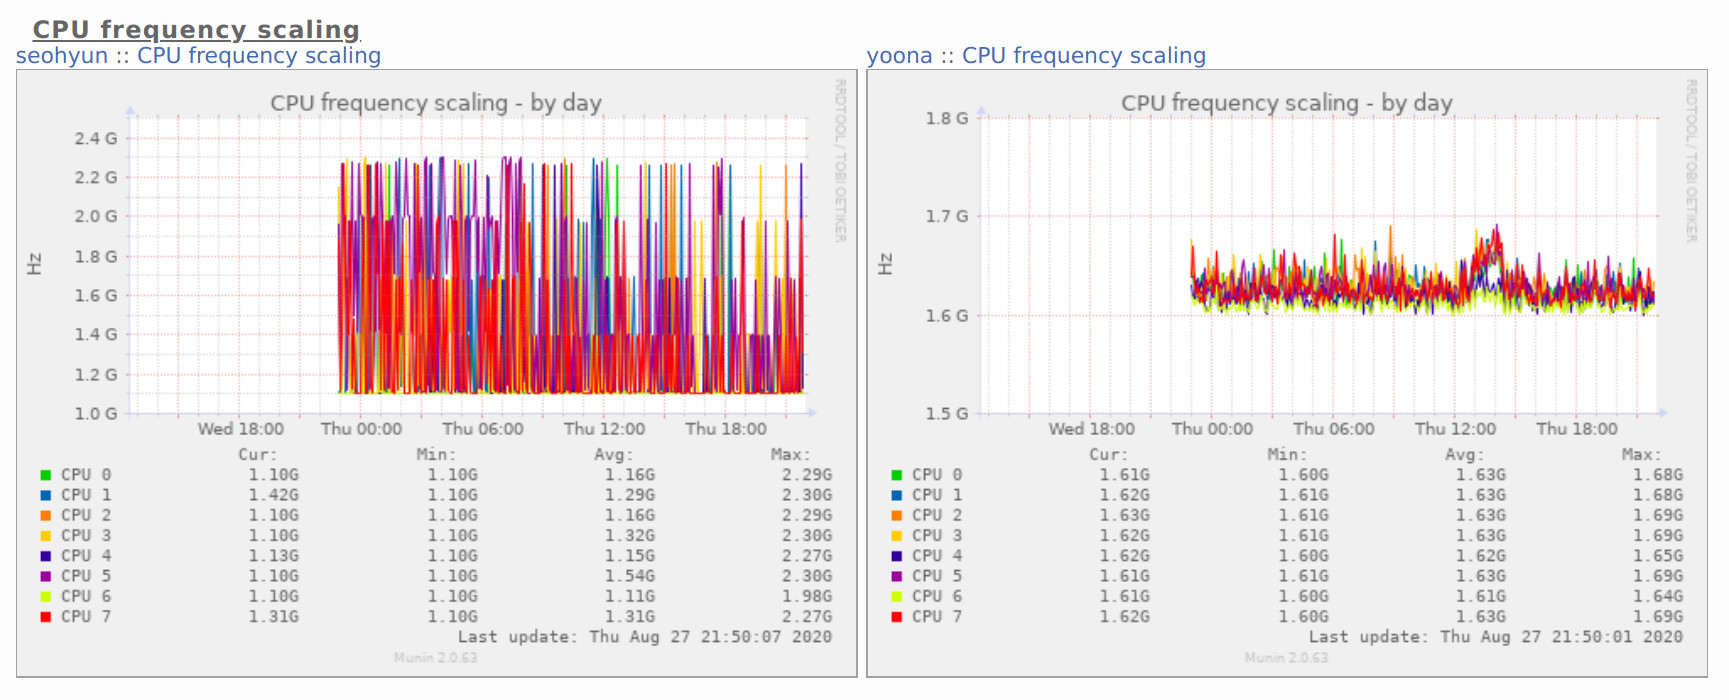
Munin 2.0.64 showing CPU frequencies on two boxes throughout a day.
Munin is a nice server monitoring suite written in Perl which consists of two parts: munin-node (or MuninLite) collects data on local and/or remote systems and munin reads that data and generates fancy web pages pages with nice graphs using RRDtool. A web server must be running on the machine graphs are generated on in order to make the graphs available to web browsers.
Munin is very pluggable, a wide variety of stock and third party plugins is available and it is quite easy to make a plugin for something special in case you would like to make a graphs showing your bathtubs temperature over time or something like that.

Enable comment auto-refresher
Anonymous (8ea6d37dcc)
Permalink |
Anonymous (8ea6d37dcc)
Anonymous (fb60b7a48c)
Permalink |
Anonymous (891dd32cd7)
Permalink |
Anonymous (0917ccd8e7)
Permalink |
Anonymous (ed5dcea31a)
Permalink |