Open-RMS-Letter Chart Generator
Two competing open letters were posted on GitHub towards the end of March, 2021. One of them voices support for honorary doctor Richard Stallman, the other viciously attacks him and demands that he is kept out of leadership positions in any and all organizations. A simple Python program can show you the popularity of each of the letters over time on a chart.
written by 윤채경 (Yoon Chae-kyung) 2021-03-28 - last edited 2021-04-07. © CC BY
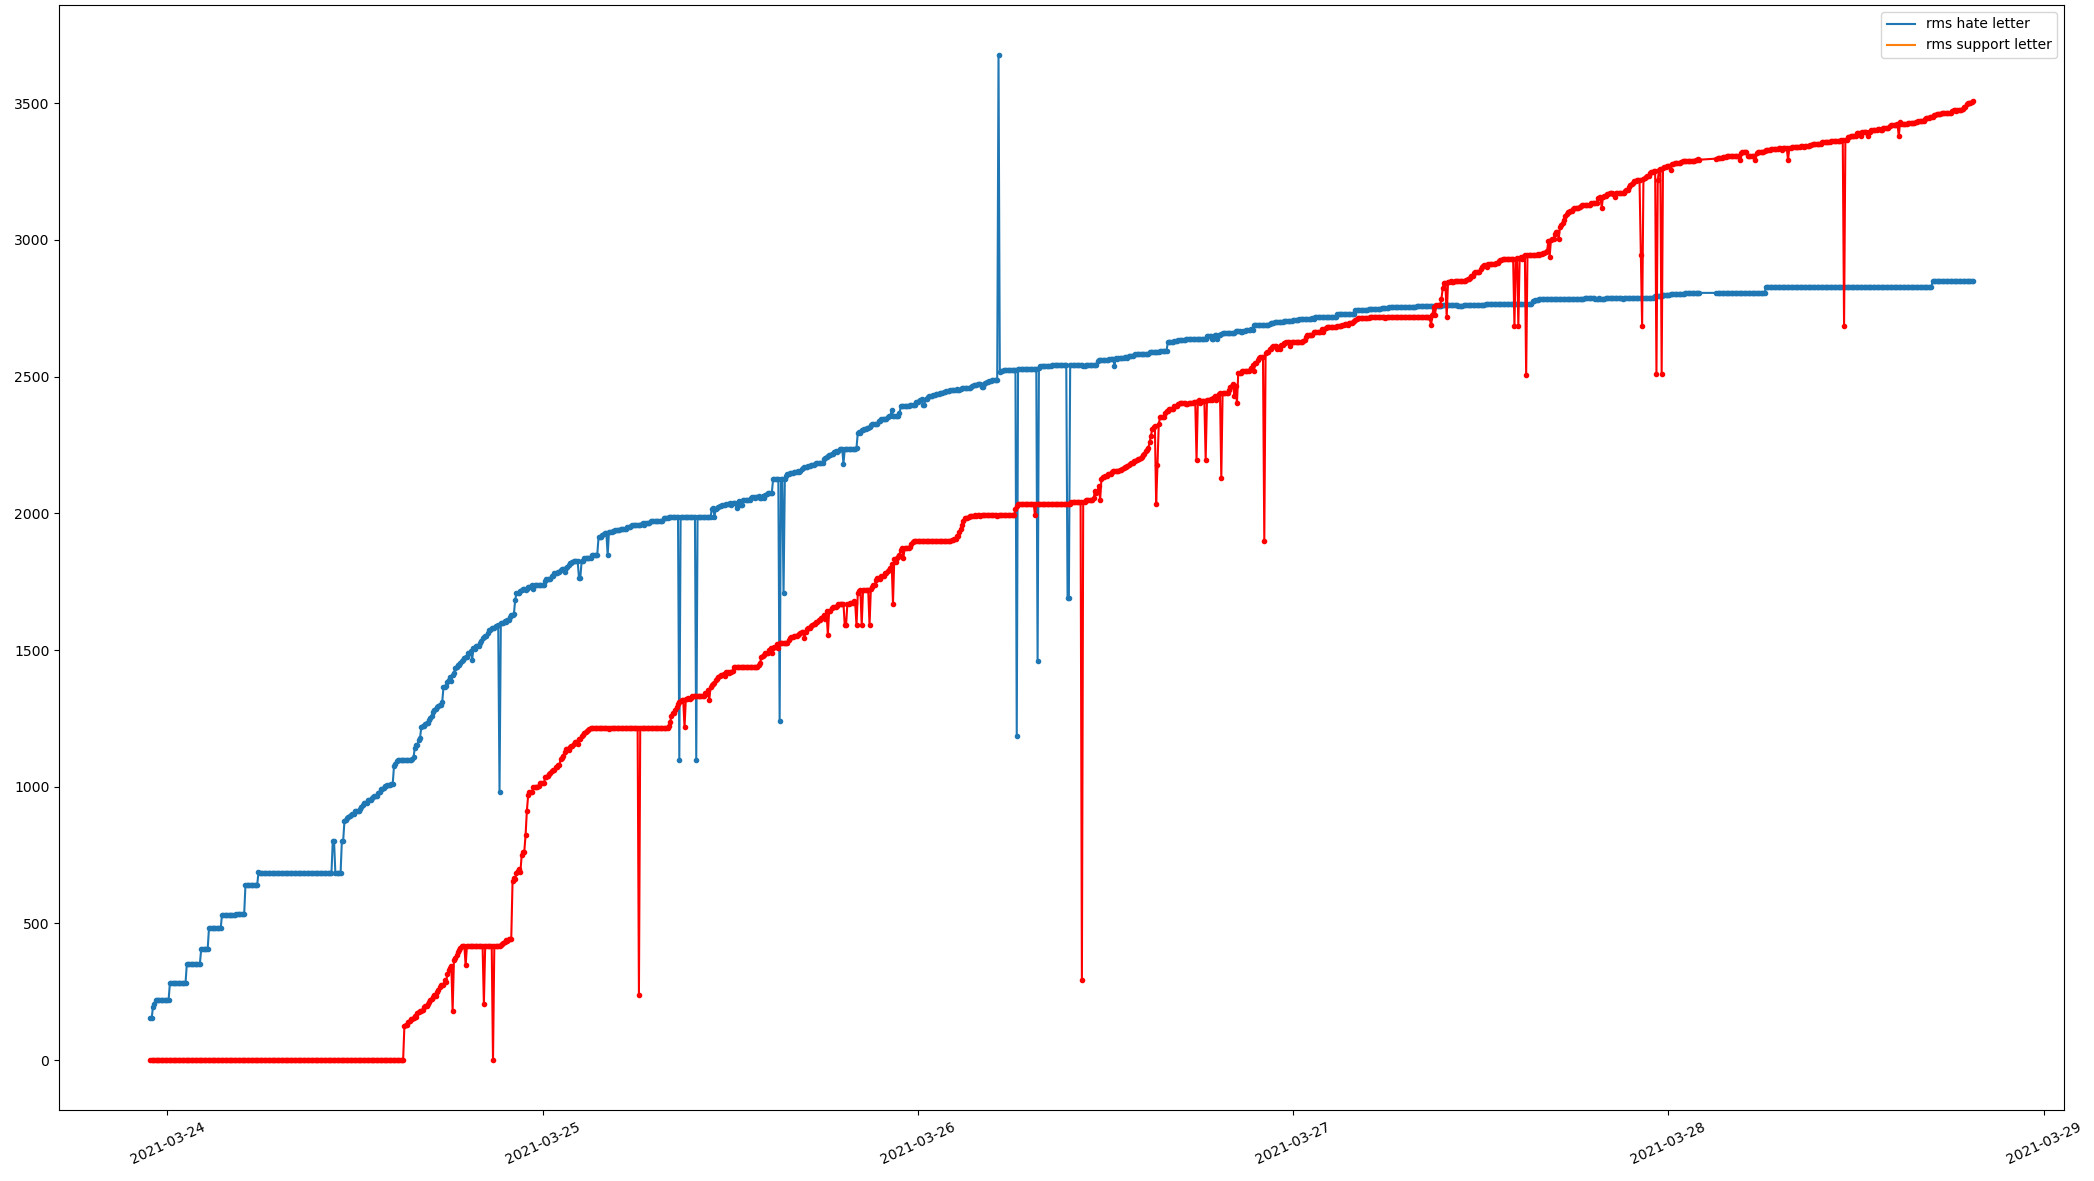
Support for Richard Stallman (red) vs vicious 白左 hate (blue).
Data as of Mar 28 05:35:34 PM UTC 2021
A developer who goes by the name "Kezi" is the author of the GPLv3 licensed Python program shown below. It uses the Mathlab Python extensions to plot how much support each of the letters have had over time on a simple chart. Colors and such can be changed using the Mathlab interface that shows up once the chart-generation process is complete.
The letter in support for Richard Stallman can be read at rms-support-letter.github.io and the letter against him can be found at rms-open-letter.github.io
count.py[edit]
The Python code doesn't actually download the repositories and they need to exist in /tmp before you run this script.
cd /tmp
git clone https://github.com/rms-open-letter/rms-open-letter.github.io.git
git clone https://github.com/rms-support-letter/rms-support-letter.github.io.git
The script can be ran with python count.py once those are in place.
There will be some initial errors output by the script. This is due to how the support letters repository changed the data structure after a few days. This can be seen as a initial flat line on the chart.
# author: Kezi
# license: gplv3

import time
import os
import subprocess
from threading import Thread

from datetime import datetime

start_time = 1616522054+60*60*4
stop_time = int(time.time())

path_open = "/tmp/rms-open-letter.github.io" # https://github.com/rms-open-letter/rms-open-letter.github.io.git
path_support = "/tmp/rms-support-letter.github.io" # https://github.com/rms-support-letter/rms-support-letter.github.io.git

cwd = os.getcwd()

def count_open():
    lol=subprocess.check_output(['sh', '-c', f"cd {path_open}; cat index.md | grep -e \"^1.\" -e \"^- \" | wc -l"])
    return int(lol)

def count_support():
    lol=subprocess.check_output(['sh', '-c', f"cd {path_support}; ls _data/signed/ | wc -l"])
    return int(lol)

def checkout_open(date):
    try:
        subprocess.check_output(['sh', '-c', f"cd {path_open}; git checkout -f `git rev-list -n 1 --before=\"{date}\" main`"])
    except:
        pass

def checkout_support(date):
    try:
        subprocess.check_output(['sh', '-c', f"cd {path_support}; git checkout -f `git rev-list -n 1 --before=\"{date}\" master`"])
    except:
        pass

def time_machine(timestamp):
    print("time machine", datetime.fromtimestamp(timestamp), timestamp)

    date=datetime.utcfromtimestamp(timestamp).strftime('%Y-%m-%d %H:%M')
    thread1 = Thread(target = checkout_open, args = (date, ))
    thread1.start()
    thread2 = Thread(target = checkout_support, args = (date, ))
    thread2.start()

    thread1.join()
    thread2.join()


dates=[]
points_open=[]
points_support=[]

for i in range(start_time, stop_time, 60*5):
    time_machine(i)

    dates.append(datetime.fromtimestamp(i))
    points_open.append(count_open())
    points_support.append(count_support())


import matplotlib.pyplot as plt
import matplotlib.dates as md

plt.subplots_adjust(bottom=0.2)
plt.xticks(rotation=25)
ax = plt.gca()
xfmt = md.DateFormatter('%Y-%m-%d')
ax.xaxis.set_major_formatter(xfmt)
plt.plot(dates, points_open, label="rms hate letter")

plt.subplots_adjust(bottom=0.2)
plt.xticks(rotation=25)
ax = plt.gca()
xfmt = md.DateFormatter('%Y-%m-%d')
ax.xaxis.set_major_formatter(xfmt)
plt.plot(dates, points_support, label="rms support letter")

plt.legend()
plt.show()
The above snippet was copied from gitlab.com/-/snippets/2096396.
Tumeo-Improved Version[edit]
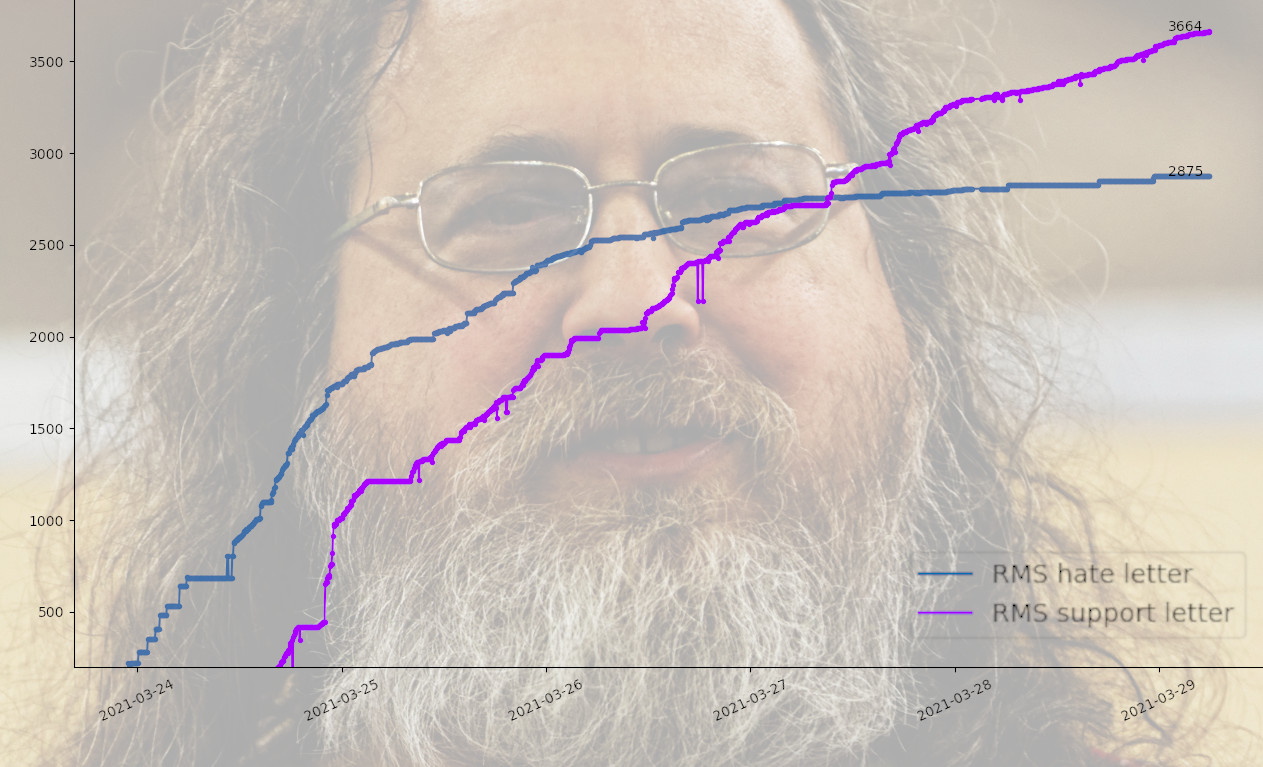
Tumeo has made the following improved version with CSV caching based on the code above. It is also available at https://replit.com/@williamd1k0/Open-RMS-Letter-Chart-Generator.
You can download Cached-data.csv (rename it to cached-data.csv) if you want historical data up to April 6th 2021 with spikes due to changes in the git repository data-structure adjusted to the prior value.
You should be able to run the following script alone or if you already have a cached-data.csv file (in the same folder as the Python script), the git repositories will be downloaded automatically to the /tmp directory.
# author: Kezi and Tumeo
# license: gplv3
# forked from: https://linuxreviews.org/Open-RMS-Letter_Chart_Generator
# version 1.0.0

import os
import time
import csv
import subprocess
from threading import Thread
from datetime import datetime

output_root = os.environ.get("OUT_ROOT", "./")
repo_root = os.environ.get("REPO_ROOT", "/tmp")

cache_file = os.path.join(output_root, "cached-data.csv")
cache_fields = "ts", "support", "hate"

start_time = 1616522054+60*60*4
stop_time = int(time.time())

path_support = os.path.join(repo_root, "rms-support-letter.github.io")
git_support = "https://github.com/rms-support-letter/rms-support-letter.github.io.git"
path_hate = os.path.join(repo_root, "rms-open-letter.github.io")
git_hate = "https://github.com/rms-open-letter/rms-open-letter.github.io.git"

cwd = os.getcwd()

def get_last_timestamp():
    f = open(cache_file, "r")
    data = csv.DictReader(f)
    data_list = list(data)
    ts = start_time
    if len(data_list) > 0:
        ts = int(data_list[-1]["ts"])
    f.close()
    return ts

def create_cache():
    f = open(cache_file, "w")
    data = csv.DictWriter(f, cache_fields)
    data.writeheader()
    f.close()

def init_repos():
    if not os.path.exists(path_support):
        subprocess.run(["git", "clone", git_support, path_support])
    if not os.path.exists(path_hate):
        subprocess.run(["git", "clone", git_hate, path_hate])

def count_hate():
    lol=subprocess.check_output(['sh', '-c', f"cd {path_hate}; cat index.md | grep -e \"^1.\" -e \"^- \" | wc -l"])
    return int(lol)

def count_support():
    lol=subprocess.check_output(['sh', '-c', f"cd {path_support}; ls _data/signed/ | wc -l"])
    return int(lol)

def checkout_hate(date):
    try:
        subprocess.check_output(['sh', '-c', f"cd {path_hate}; git checkout -f `git rev-list -n 1 --before=\"{date}\" main`"])
    except:
        pass

def checkout_support(date):
    try:
        subprocess.check_output(['sh', '-c', f"cd {path_support}; git checkout -f `git rev-list -n 1 --before=\"{date}\" master`"])
    except:
        pass

def time_machine(timestamp):
    print("time machine", datetime.fromtimestamp(timestamp), timestamp)

    date=datetime.utcfromtimestamp(timestamp).strftime('%Y-%m-%d %H:%M')
    thread1 = Thread(target = checkout_hate, args = (date, ))
    thread1.start()
    thread2 = Thread(target = checkout_support, args = (date, ))
    thread2.start()

    thread1.join()
    thread2.join()

init_repos()

dates = []
points_hate = []
points_support = []

if os.path.exists(cache_file):
    start_time = get_last_timestamp()
    f = open(cache_file, "r")
    data = csv.DictReader(f)
    for row in data:
        dates.append(datetime.fromtimestamp(int(row["ts"])))
        points_support.append(int(row["support"]))
        points_hate.append(int(row["hate"]))
    f.close()
else:
    create_cache()

f = open(cache_file, "a")
cache = csv.DictWriter(f, cache_fields)

for i in range(start_time, stop_time, 60*5):
    ts = datetime.fromtimestamp(i)
    if len(dates) > 0 and dates[-1] == ts:
        continue
    time_machine(i)
    dates.append(ts)
    support_count = count_support()
    hate_count = count_hate()
    points_support.append(support_count)
    points_hate.append(hate_count)
    cache.writerow({
        "ts": i,
        "support": support_count,
        "hate": hate_count
    })

f.close()

os.environ["MPLCONFIGDIR"] = "/tmp"
import matplotlib.pyplot as plt
import matplotlib.dates as md

plt.subplots_adjust(bottom=0.2)
plt.xticks(rotation=25)
ax = plt.gca()
xfmt = md.DateFormatter('%Y-%m-%d')
ax.xaxis.set_major_formatter(xfmt)
plt.plot(dates, points_hate, label="RMS hate letter")

plt.subplots_adjust(bottom=0.2)
plt.xticks(rotation=25)
ax = plt.gca()
xfmt = md.DateFormatter('%Y-%m-%d')
ax.xaxis.set_major_formatter(xfmt)
plt.plot(dates, points_support, label="RMS support letter")

ax.annotate(points_support[-1], xy=(dates[-1], points_support[-1]), xytext=(-30, 0), textcoords="offset points")
ax.annotate(points_hate[-1], xy=(dates[-1], points_hate[-1]), xytext=(-30, 0), textcoords="offset points")

plt.legend()
plt.show()

Enable comment auto-refresher
Tumeo
Permalink |