HOWTO See A Games Frames Per Second And Other Data In A HUD Overlay
A heads up display which shows you your games frames per second and other data such as frame-times, CPU load, GPU temperature may be desirable either your streaming with OBS or just curious about your performance
metrics. There are stand-alone programs that do this such as Fraps on the Windows platform. GNU/Linux doesn't really have anything like that and it does not need it either because heads-up displays are built right into the graphics stack. If you have play OpenGL or Vulkan games on your GNU/Linux machine then you got what you need to have a Heads Up Display showing fancy graphs.
Heads Up Display With FPS Counter And Other Data In OpenGL Games[edit]
GALLIUM_HUD can provide you with a heads-up display which shows frames per second, CPU load and other data. Gallium3D is in principle a shared architecture which can, in theory, be used by MESA graphics drivers. It has been used by the free AMD and Nvidia (Nouveau) drivers. The newer Intel Iris OpenGL graphics driver for gen8+ Intel chips (default as of Mesa 20) uses Gallium, the older i965 Intel driver does not (which means that GALLIUM_HUD won't work).
GALLIUM_HUD works with any OpenGL game or application as long as the graphics driver supports it.
The trick to invoking the Heads Up Display is to start your application with an environment-variable called
GALLIUM_HUD=""
with some configuration values followed by your applications executable.
The values you want are a set of
.w[widthinpixels] .h[heightinpixels]
and probably .c[MaxHighNumberinthegraph] followed directly by a
identifier you would like to measure. Add :[Y-axis-max] after the measurement-keyword to set the initial Y-axis to something slightly higher than what value will top out at. For fps 70 makes sense if you are capped at 60fps. This value is only initial, if it's set at 70 and the value goes to 80 it adjust. Thus, you should set .c[value] to the same as :[value] if you want a fixed Y-axis.
For a graph of frames per second at a resolution of 4K you could start your game with:
GALLIUM_HUD=".w550.h280.c70fps:70" supertuxkart
Notice there is no space or nothing between .c70 and fpswhich it measures.
Use lower .width and .height values for lower resolutions. Something like .w250.h140 is fine for 1080p.
If you want more than one graph you can add them separated by a , comma.
Thus, if you'd like to see fps and GPU temperature while playing SuperTuxKart you could start it with:
GALLIUM_HUD=".w550.h280.c70fps:70,.w550.h280.c80temperature:80" supertuxkart
You likely also want a graph showing GPU-load
You can have many things in the same graph area, a graph box is not restricted to just one thing. It makes sense to have similar things in the same box while totally different readings look silly. CPU cores is one example where it makes sense. Add + between the items you'd like:
GALLIUM_HUD=".w550.h280cpu0+cpu1+cpu2+cpu3+cpu4+cpu5+cpu6+cpu7+cpu8+cpu9+cpu10+cpu11:100"
Having a dual-core is obviously an advantage if you'd like to monitor all the CPU cores and threads. There is no need for a .c cap on the CPU since a single core will never have more than a 100% load.
You can use the .d option instead of .c to have the graphs ceiling dynamically
adjust to the higest value present in the graph. You can also use .d in combination
with .c.
What options are available?[edit]
Start any simple OpenGL program such as glxgears or glmark2 with the GALLIUM_HUD variable set to help and it will show you all the things you can monitor. And there are a lot as in plenty of things you can monitor.
GALLIUM_HUD="help" glxgears
The list of items you can monitor is really long and varies from GPU-driver to GPU-driver. Most are not that useful or interesting unless you are a developer. fps, frametime, cpu, VRAM-usage, temperature, GPU-load, shader-clock and memory-clock are the more interesting values you may like to monitor.
Example GALLIUM_HUD Heads Up Display Configuration[edit]
Combining above the examples above we can show a graph of frames per second, a graph of GPU load, a graph GPU temperature and one showing the load of each CPU thread with:
MONITORGPU=".w550.h280.c70fps:70,.w550.h280GPU-load:100,.w550.h280.c80temperature:80"
MONITORCPU=".w550.h280cpu0+cpu1+cpu2+cpu3+cpu4+cpu5+cpu6+cpu7+cpu8+cpu9+cpu10+cpu11:100"
GALLIUM_HUD=${MONITORGPU},${MONITORCPU} supertuxkart
Saving your HUD settings and starting games with them[edit]
It is of course possible to always have a HUD on everything OpenGL by exporting a GALLIUM_HUD
variable in $HOME/.bashrc. This is not exactly ideal. A better solution would be to put your preferred HUD settings in a script file like $HOME/bin/run-with-hud.sh which can be used to run your games.
For a nice HUD at 4k you can put something like
MONITORGPU=".w550.h280fps:70,.w550.h280GPU-load:100,.w550.h280temperature:80"
MONITORCPU=".w550.h280cpu0+cpu1+cpu2+cpu3+cpu4+cpu5+cpu6+cpu7+cpu8+cpu9+cpu10+cpu11:100"
GALLIUM_HUD=${MONITORGPU},${MONITORCPU} "${@}"
in $HOME/bin/run-with-hud-4k.sh and make it executable with chmod a+x $HOME/bin/run-with-hud-4k.sh and start your games
with run-with-hud-4k.sh yourgamesexecutable
Use smaller values if you are gaming on 1080p.
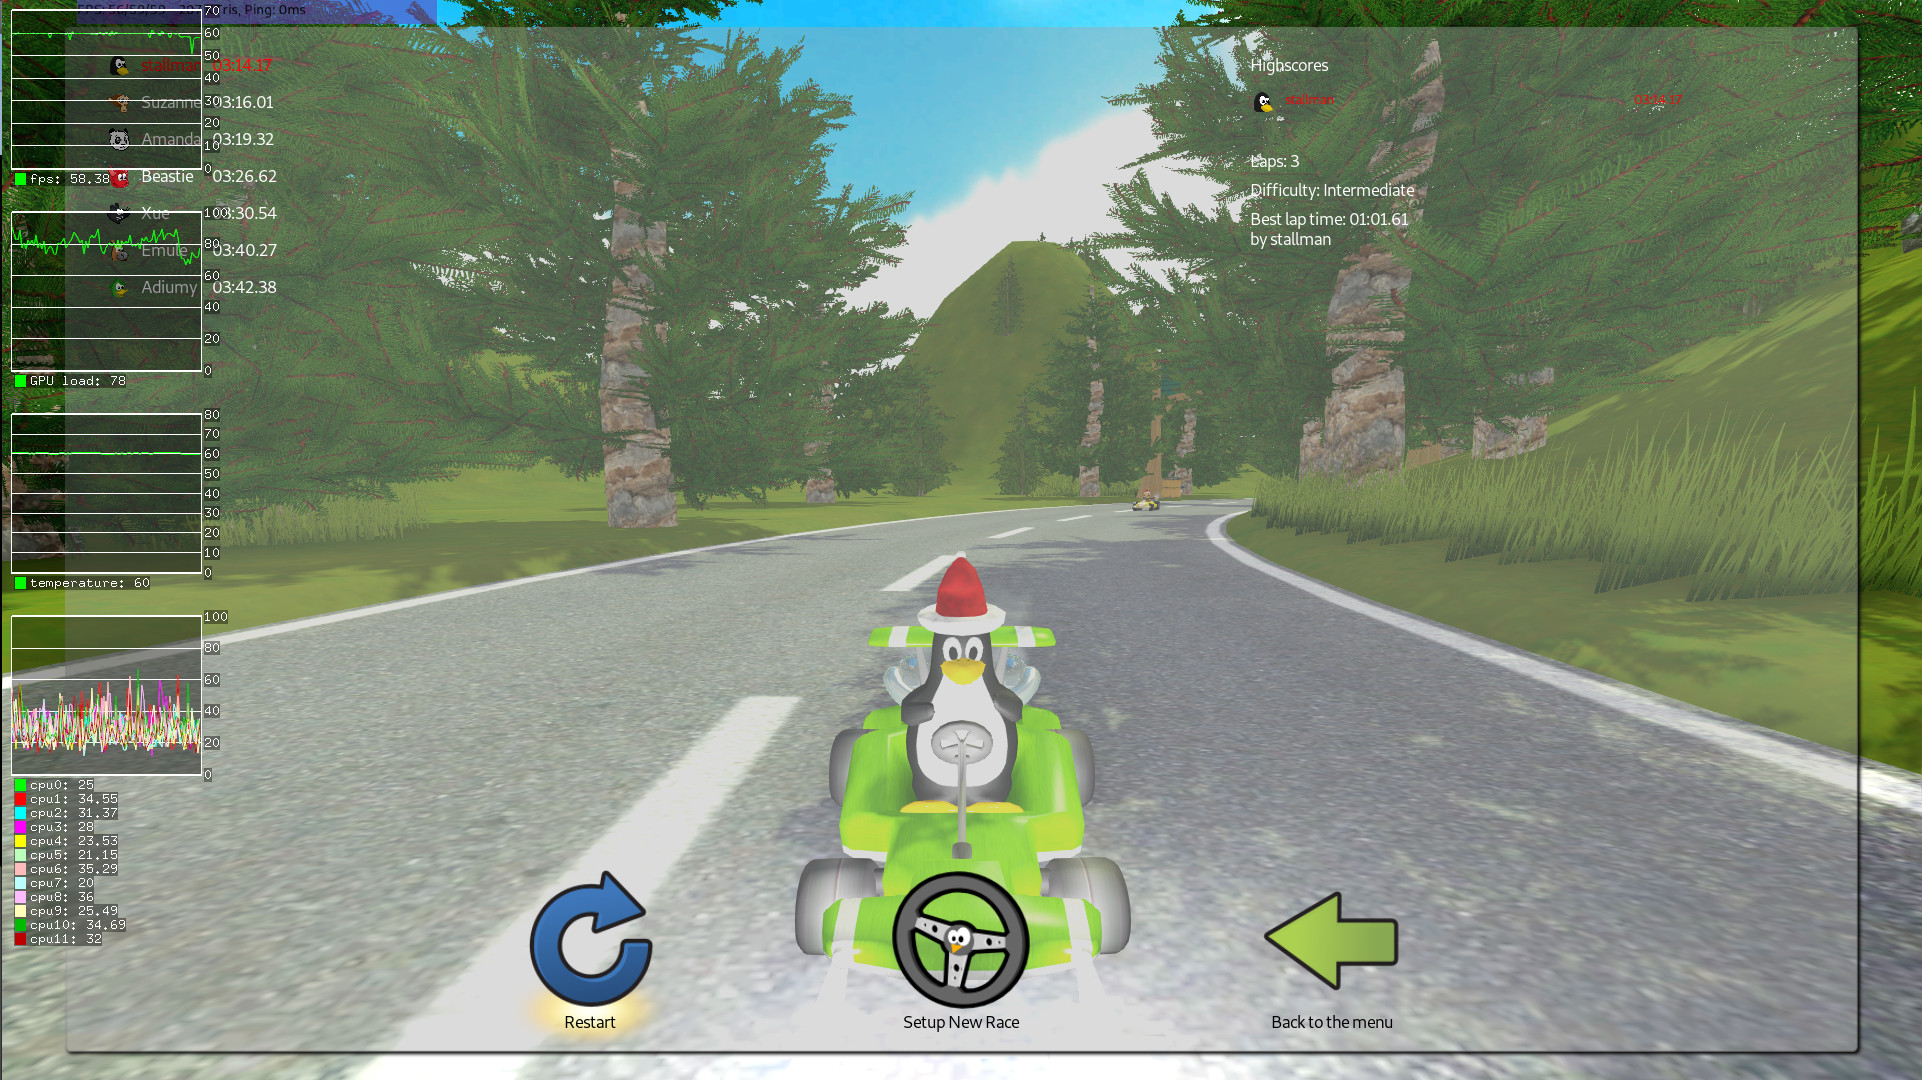
How the HUD display shown below looks on SuperTuxKart at 1080p.
MONITORGPU=".w190.h160fps:70,.w190.h160GPU-load:100,.w190.h160temperature:80"
MONITORCPU=".w190.h160cpu0+cpu1+cpu2+cpu3+cpu4+cpu5+cpu6+cpu7+cpu8+cpu9+cpu10+cpu11:100"
GALLIUM_HUD=${MONITORGPU},${MONITORCPU} "${@}"
Heads Up Display With FPS Counter And Other Data In Vulkan Games[edit]
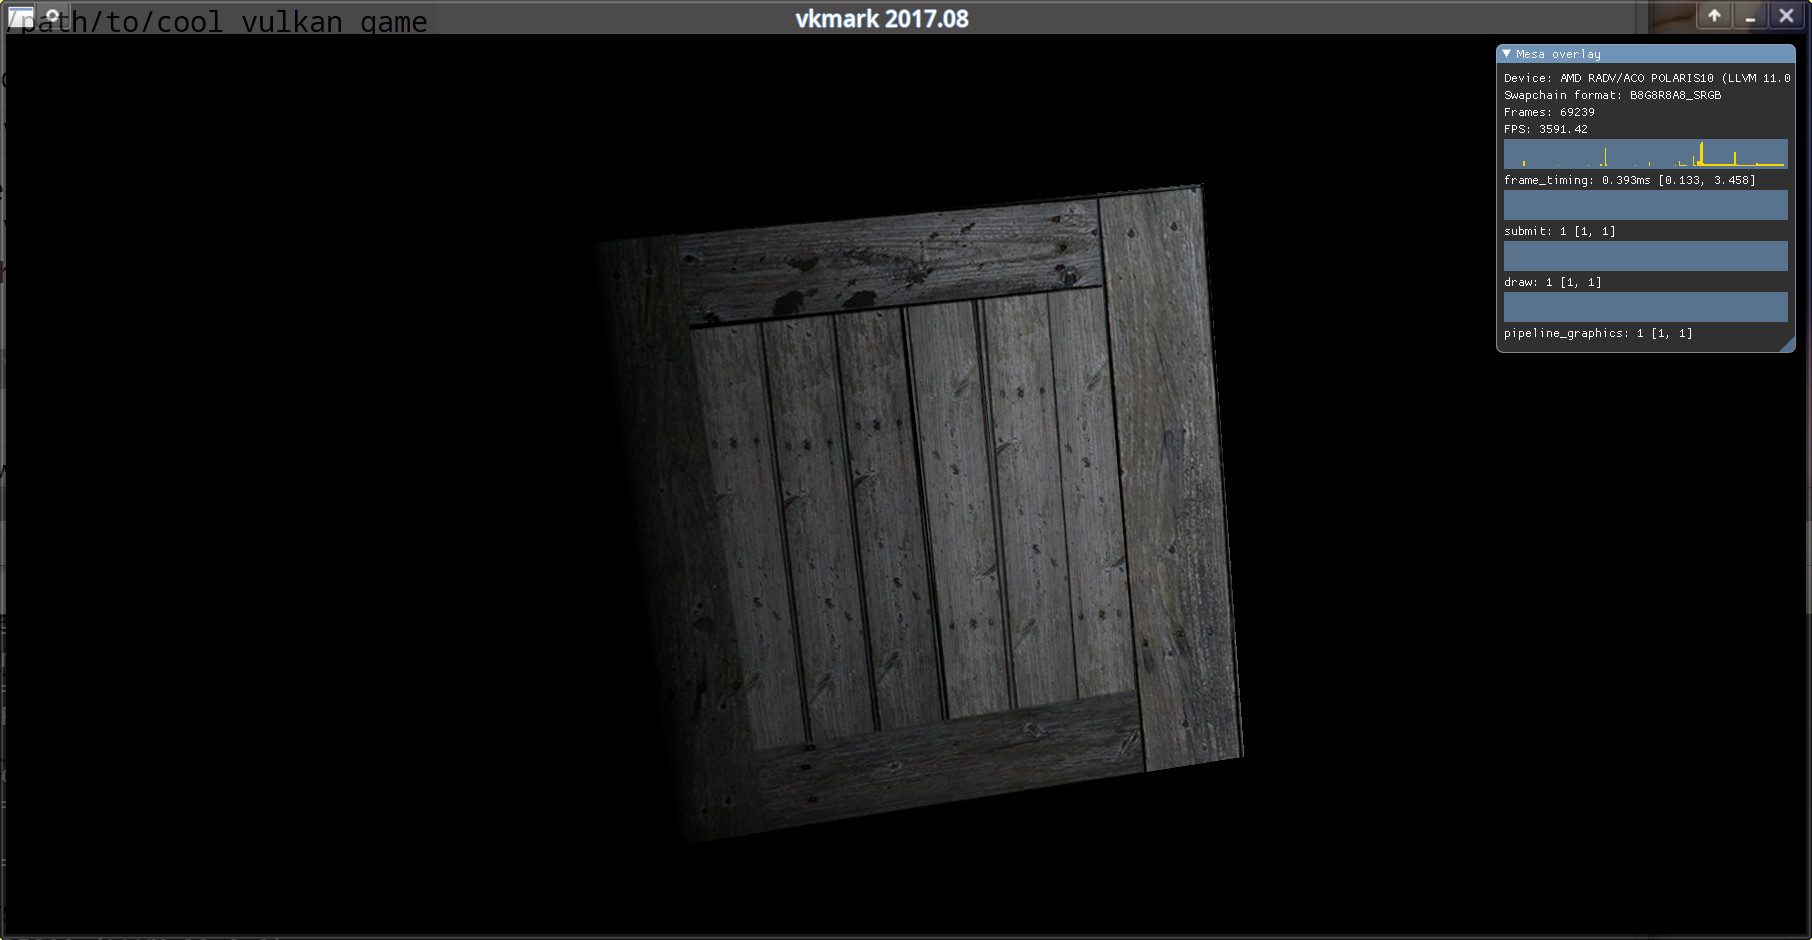
vkmark with a Vulkan HUD.
The Mesa Vulkan drivers have a built-in HUD overlay with quite a few options. It can be activated by using the variable called VK_INSTANCE_LAYERS to ask for a VK_LAYER_MESA_overlay before a game or application is executed:
VK_INSTANCE_LAYERS=VK_LAYER_MESA_overlay /path/to/cool_vulkan_game
Configuring the Vulkan HUD overlay can be done by configuring a VK_LAYER_MESA_OVERLAY_CONFIG variable:
VK_INSTANCE_LAYERS=VK_LAYER_MESA_overlay VK_LAYER_MESA_OVERLAY_CONFIG=position=top-left /path/to/cool_vulkan_game
The are numerous options available which can be used to configure VK_LAYER_MESA_OVERLAY_CONFIG=. The desired variables should be comma-separated. You can use VK_INSTANCE_LAYERS=VK_LAYER_MESA_overlay VK_LAYER_MESA_OVERLAY_CONFIG=help /path/to/some_vulkan_app to list them. You have to provide a game or program like vkmark to get a list of options, nothing happens if you use glxgears (which uses OpenGL). You will have to experiment and play around with the options to find out what suits you. Perhaps you would like this one:
VK_INSTANCE_LAYERS=VK_LAYER_MESA_overlay VK_LAYER_MESA_OVERLAY_CONFIG=fps,submit,draw,pipeline_graphics,position=top-right /path/to/cool_vulkan_game
High-resolution users will likely want to add width=width-in-pixels and height=height-in-pixels
MangoHud[edit]
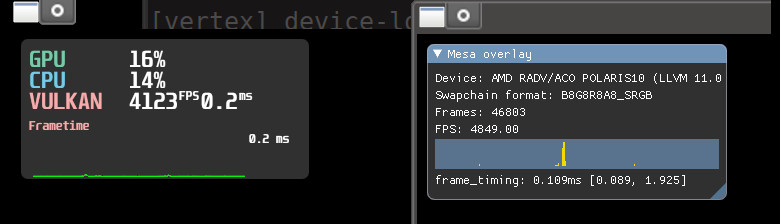
MangoHud (left) vs the built-in Mesa HUD (right).
MangoHud is a fork of the built-in Mesa Vulkan HUD with more options. It can, unlike the built-in Mesa Vulkan HUD, be configured using a simple configuration file. Its also got a handy F12 keyboard shortcut for switching the HUD on/off.
See the MangoHud for more details.
Heads Up Display In Games Running In WINE With DXVK[edit]
The optional DXVK Direct3D to Vulkan translation layer for Wine (typically available as a package named wine-dxvk) comes with its own built-in heads-up display. It is configured and activated with a variable called DXVK_HUD. Setting it to DXVK_HUD=1 enables device information and a frame counter (DXVK_HUD=1 equals DXVK_HUD=evinfo,fps. It has several other option available:
| devinfo | Displays the name of the GPU and the driver version. |
| fps | Shows the current frame rate. |
| frametimes | Shows a frame time graph. |
| submissions | Shows the number of command buffers submitted per frame. |
| drawcalls | Shows the number of draw calls and render passes per frame. |
| pipelines | Shows the total number of graphics and compute pipelines. |
| memory | Shows the amount of device memory allocated and used. |
| gpuload | Shows estimated GPU load. May be inaccurate. |
| version | Shows DXVK version. |
| api | Shows the D3D feature level used by the application. Does not work correctly for D3D10 at the moment. |
| compiler | Shows shader compiler activity |
You can use DXVK_HUD and VK_LAYER_MESA_overlay (described above) at the same time - but you probably don't want to.
Heads Up Display In Games Running In WINE Without DXVK[edit]

A Windows game running in Wine without DXVK.
Wine translates Direct3D to OpenGL if the optional DXVK Direct3D to Vulkan translation layer is missing. Any game running in Wine is a OpenGL game as far as the graphics drivers are concerned. The Gallium OpenGL HUD can therefore be enabled on any game running in Wine.
Simple FPS Counter In Steam Games[edit]
Steam has it's own built-in in-game FPS counter overlay. Navigate through the menu Steam then Settings and select In-Game and you will be able to enable a FPS counter in one of your monitors corners. This will only display a FPS counter which shows the current framerate as a number.
You can use Gallium HUD with Steam too, but there's a catch: It will draw your graphs above every window since the Steam games store/launcher is drawn using OpenGL. You get it on the Steam store, every pop-up and so on. That is not exactly ideal but it does work.

Enable comment auto-refresher