sar
sar is a small command-line utility for collecting, reporting and saving system information information. It is a generalized versatile tool for system activity reporting which can be used to monitor CPUs, memory, networking throughput and a whole lot of other incriminating information about a system. Knowing sar's basic options is useful if you need to investigate what is going on with a highly loaded production machine.
Features and Use[edit]
sar is part of the sysstat system utility package by Sebastien Godard (install sysstat to get it, there is no separate package named sar). Installing the sysstat package will either create two broken systemd files which do nothing in /usr/lib/systemd/system/ named sysstat-collect.timer and sysstat-collect.service or a functioning cron job depending on the GNU/Linux distribution chosen. The cron-job invokes sysstat's bundled sa{X} commands who write to logs in the /var/log/sa/ folder. One log is a binary file named sa{dayofmonth} and the other is a plain text file with CPU load information named sar{dayofmonth}. The sar command can interpret and output the incriminating information contained in those logs as well as other information. sar needs it's -f option to read the binary log files. sysstat will also install a sysstat-summary.service.
Real-time monitoring[edit]
sar will by default show historical information from the last logs. There is a -f option for reading log-files from specific dates. Invoking sar with a interval and optionally a number of lines to output - and no -f option - will reveals time-time data.
Simple CPU monitoring[edit]
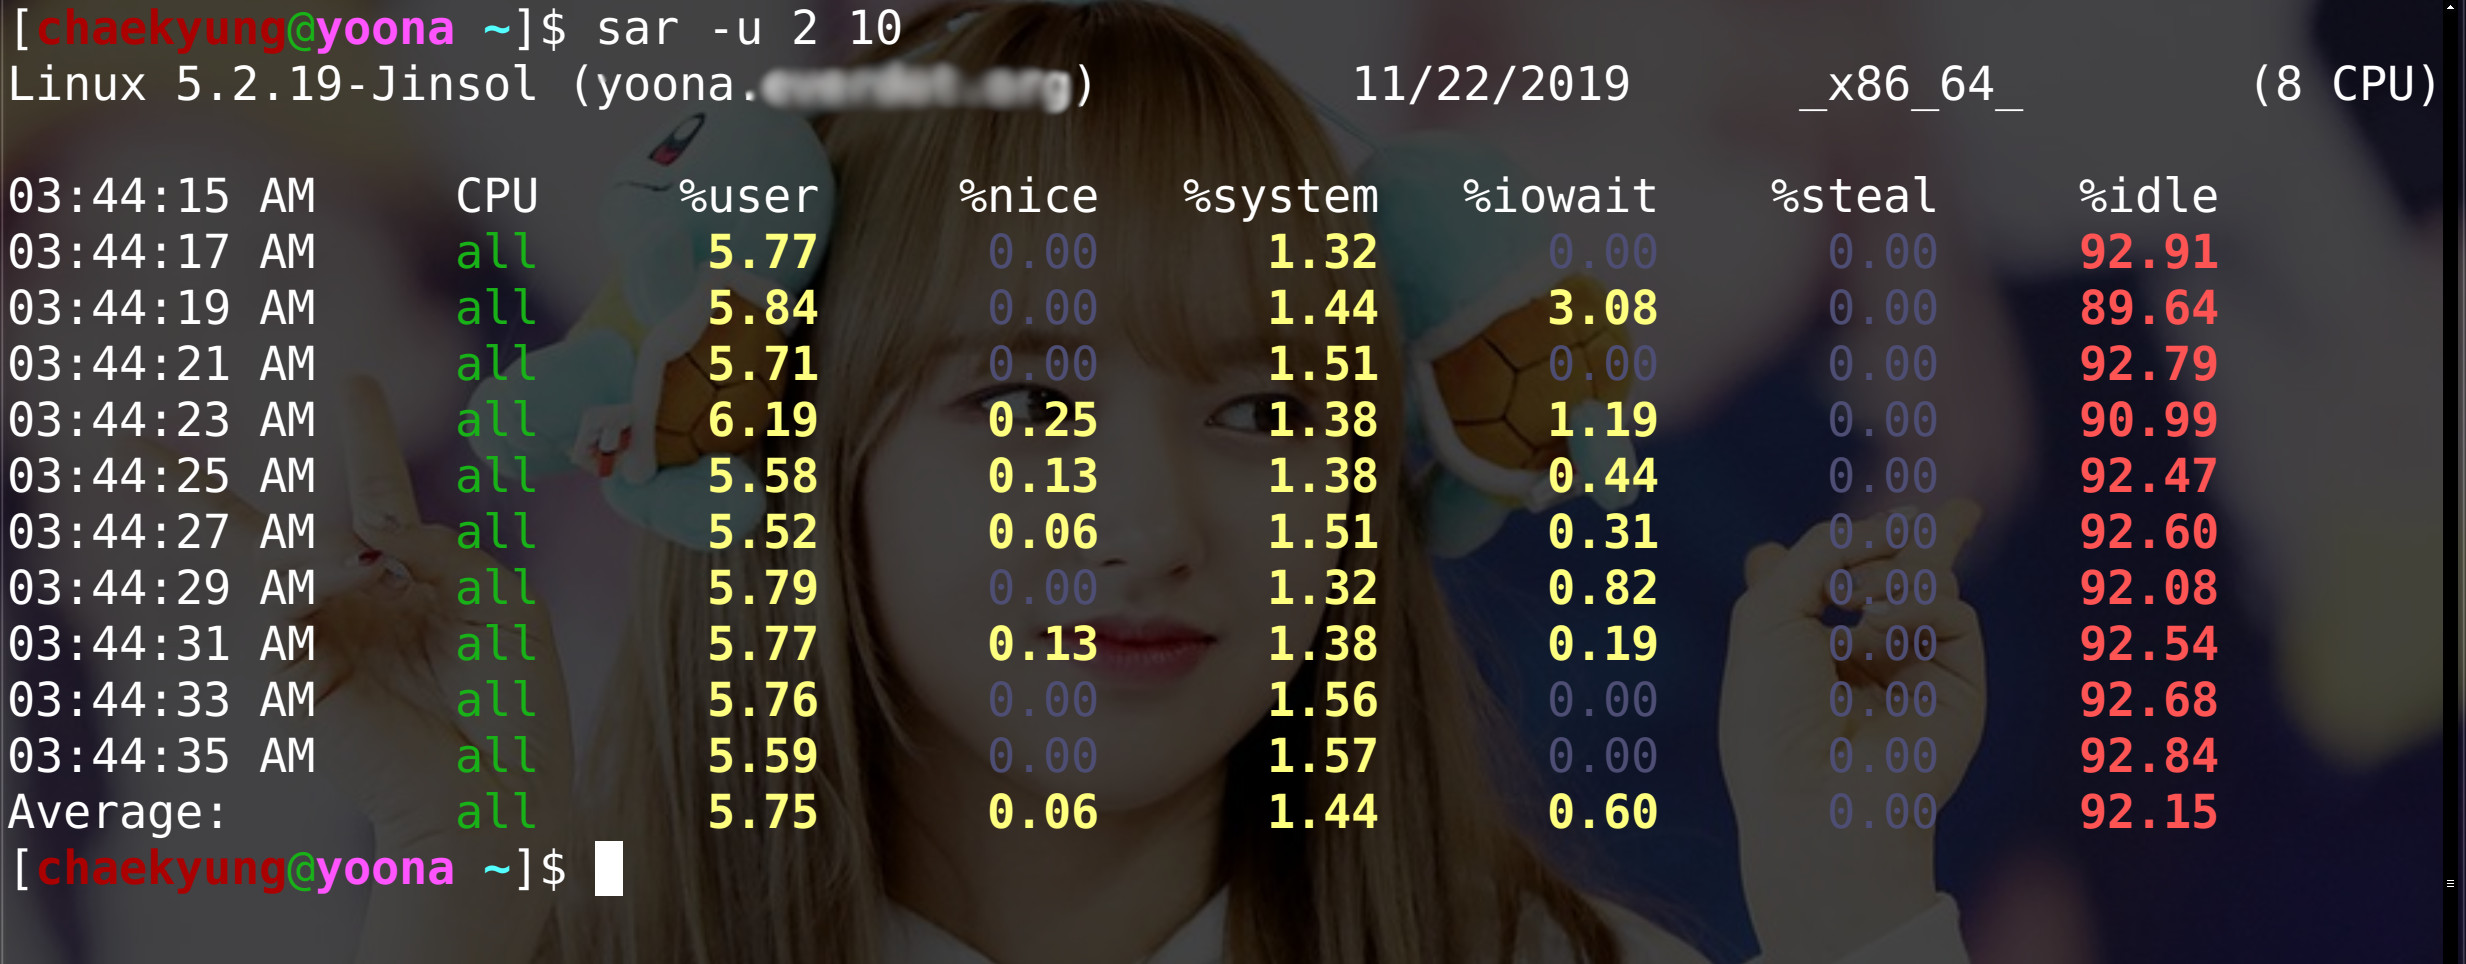
An example of sar when invoked with sar -u 2 10 where -u 2 specifies CPU use every 2 seconds and 10 specifies 10 lines of output.
sar's -u ("Report CPU utilization") option allows you to monitor CPU utilization in real-time. The -u parameter takes a number of seconds between snapshots as an argument. sar itself takes a number of lines to be displayed as an argument. That argument is optional and sar will happily keep on producing output until ctrl-c is pressed to abort if if no such parameter is specified. Thus, running sar with options for monitoring CPU usage with snapshots taken every second over a period of 20 seconds (=lines since each line is output every second) is done with sar -u 1 20 and a 10 line report with snapshots taken every 5 seconds can be generated with sar -u 5 10. The options and the output is very similar to vmstat's.
Some Useful Monitoring Options[edit]
sar can show a lot of data.
| -r | Display memory statistics |
| -n DEV | Display network statistics. Lists network interfaces and statistics about them |
| -n ALL | Lists all available network statistics |
| -b | I/O and transfer rate statistics, total system-wide |
| -d | Per block-device I/O and transfer rate statistics |
| -u | Show CPU utilization |
These can all be used with the interval and number of lines parameters shown in the CPU (-u) example above. Showing 10 lines of real-time memory information with a snapshot every 2 seconds is done with sar -r 2 10
sar will keep going forever if you omit a number of lines value and simply run sar -r 2 to get data every two seconds. You can, like with most programs, press ctrl-c to terminate it.
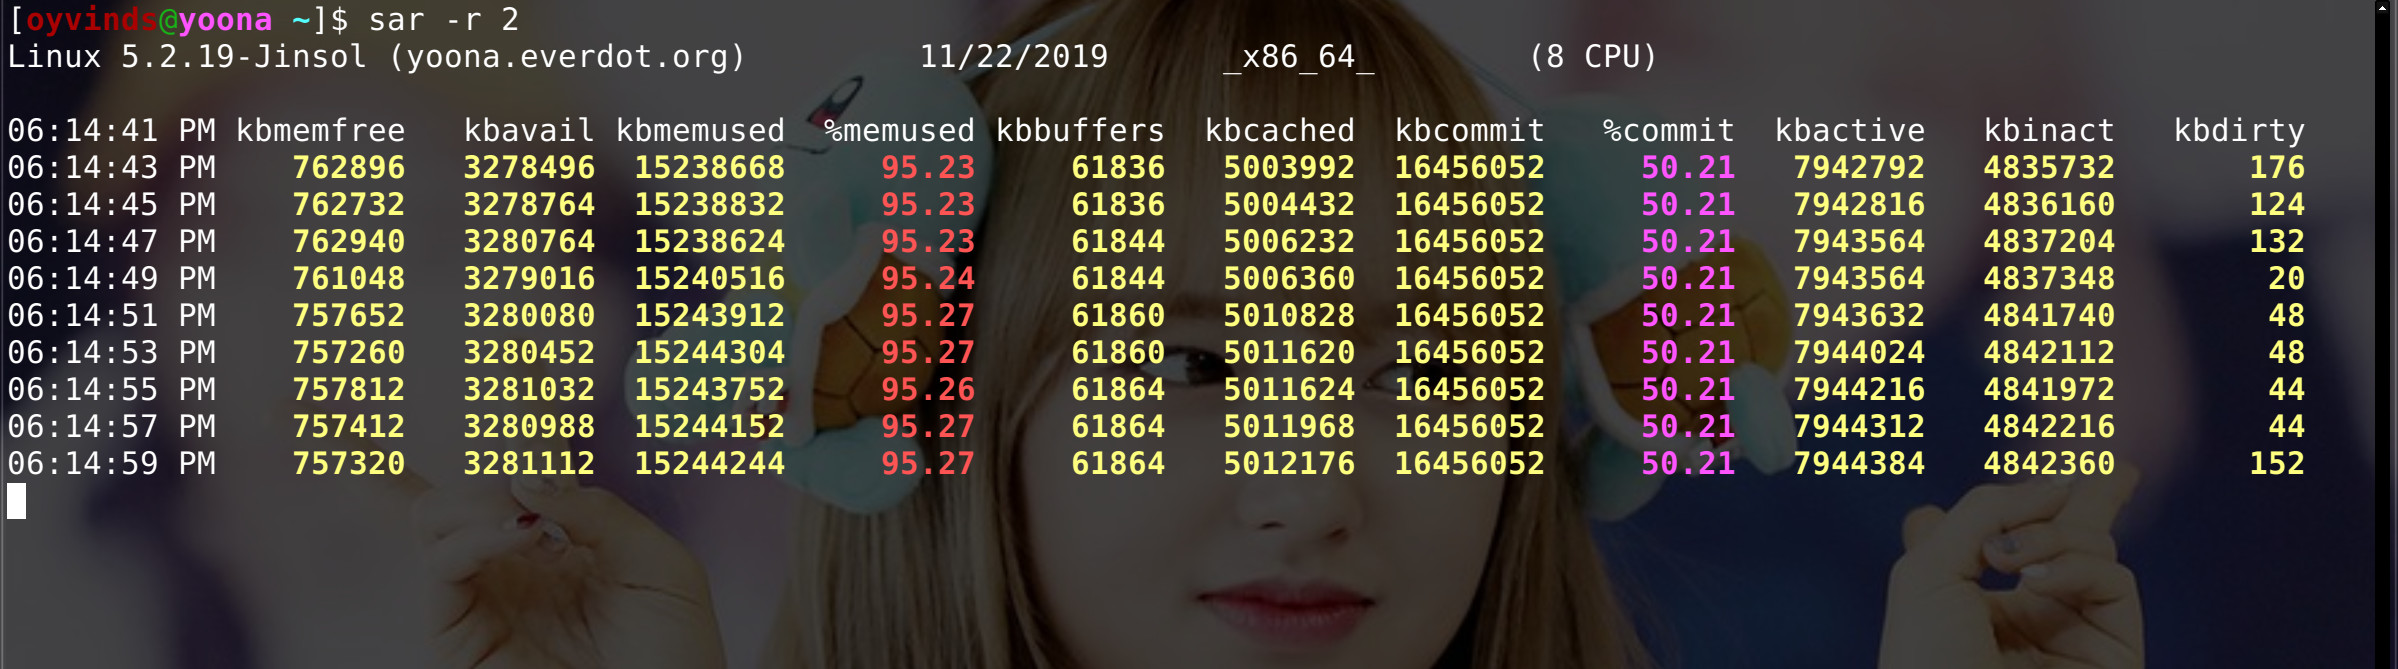
sar showing incriminating information about a computers memory use in real-time with snapshots every 2 seconds.
Accessing Historical Information[edit]
sar can also be used to view historical information. The Trick which is used by the power l33t is to invoke the sar commands -f option to read it's log-files contained within /var/log/sa/. sar will also output the last available historical information if it is executed with no interval option.
The sar log files is created by a cron job created in /etc/cron.d/sysstat on CentOS 7. Fedora 31 and most other systemd distributions will not install any cron job; they will instead install two broken systemd timers which do not create any logs. The working cron-job from CentoS 7 which can be placed in /etc/cron.d/sysstat on Fedora 31 and probably other distributions looks like:
# Run system activity accounting tool every 10 minutes
*/10 * * * * root /usr/lib64/sa/sa1 1 1
# 0 * * * * root /usr/lib64/sa/sa1 600 6 &
# Generate a daily summary of process accounting at 23:53
53 23 * * * root /usr/lib64/sa/sa2 -A
 |
Note: You could run systemctl enable sysstat and systemctl list-timers --all and check if sysstat-collect.timer and sysstat-summary.timer get scheduled to be executed regularly or not. Perhaps someone fixed them so they get scheduled on your GNU/Linux distribution. You'll probably see n/a instead of timestamps; no data will be collected if that's the case.
|
sar can be asked to reveal historical information from log files by using the -f option and a full path to a log-file as a parameter. These files are placed in /var/log/sa/ and they are named sa{dayofmonth} - always with two digits - so a log file from the 8th would be sa08 - NOT sa8.
The parameters specifying what you want information about are the same as you would use for real-time data. Specifying the interval of the data is slightly more tricky. The above cron job saves data every 10 minutes (=600 seconds) which means that values less than that are ignored. 1200 would be every 20 minutes (60 seconds in a minute * 20).

sar showing a hourly CPU information snapshot from November 8th 2019 on a box with low load.
If you require a snapshot of the CPU load every hour for the first 10 hours of that day then the -u option should be used to specify that CPU data is what you want and it's option should be 3600 (60 seconds * 60 minutes = 1 hour). Thus we get sar -u 3600 10 -f /var/log/sa/sa08
Summary: Choosing Real-Time Or Historical Informatoin[edit]
sar -u 1 10will output ten lines of real-time data with 1-second snapshots.sar -uwill output the last available historical information.sar -u -f /var/log/sa/sa04will output CPU usage snapshots at the interval they were recorded using the log file for the 4th of the month. That list may be long since no number of lines is specified.sar -u 3600 20 -f /var/log/sa/sa04will output 20 lines of CPU use snapshots from the top of the hour on the 4th day of the month.
Conclusion[edit]
sar can be very useful if you would like to know why a box serving some service is or was slow or unresponsive. Other tools like vmstat and iostat can get some of the same real-time information but they can't tell you what happened yesterday or a day last week. sar can tell you if the box is or was low on memory, if it's network was at capacity, if it is doing too much slow I/O and so on.
The sar manual page is very long and it may be worth a look.
sar is a part of the sysstat package. It's homepage is at sebastien.godard.pagesperso-orange.fr.

Enable comment auto-refresher