vmstat
vmstat is a very handy console system monitoring utility that will give you a nice brief overview of the most essential system statistics like running processes, memory usage, swap paging, disk I/O and processor activity. It is specially useful on remote servers.
Features
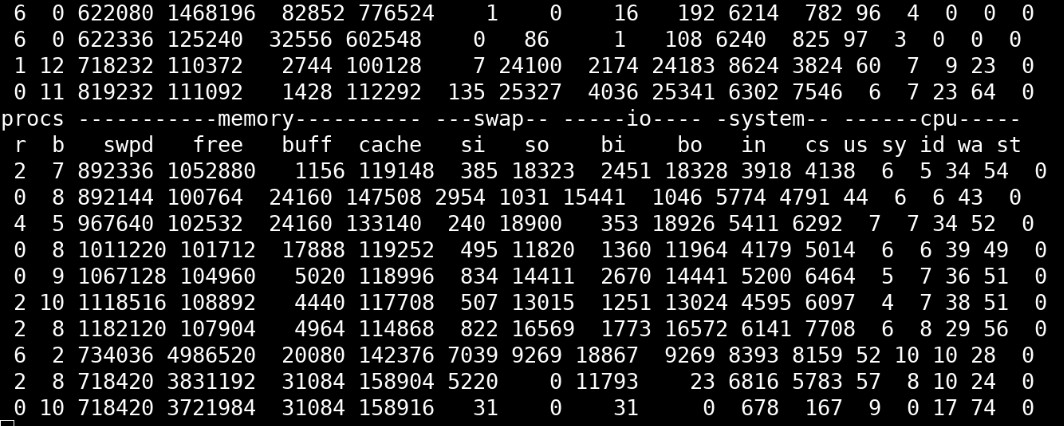
vmstat showing a machine swapping like crazy. Notice how wa(it) goes up and CPU use goes down when the machine is swapping.
System Statistics
vmstat is best run with a simple number in seconds as a single argument. It will print one line showing a variety of very useful system statistics since last reboot if it is executed with no arguments. It will, when given a argument in seconds, print one line with system statistics every X seconds. The output of vmstat 4 will typically look something like this:
 procs -----------memory---------- ---swap-- -----io---- --system-- ----cpu----
  r  b   swpd   free   buff  cache   si   so    bi    bo   in    cs us sy id wa
  5  2 482160  42276  21960 428804    0    0     0     0   15     7 26 10 51 13
  7  0 482160  33356  22088 438228    0    0     0     0  489  1521 29 71  0  0
  9  2 482160  33684  23500 436580    0    0     0     0  418  1146 49 43  0  8
  6  1 482160  33732  24908 434892    0    0     0     0  331  1299 68 22  0 10
  4  0 482160  34000  25988 433876    0    0     0     0  345  1777 66 29  0  5
  5  1 482160  32592  27092 434132    0    0     0     0  280  1171 72 22  0  7
The information vmstat provides can be very useful if you know what it means.
| Statistic | Type | Description | Advice |
|---|---|---|---|
r
|
Processes | Processes that are either running or waiting for run time. It does not show idle processes that are simply started. These are processes that are actively running or trying to run. | You generally do not want the number of running processes to be above 3x the number of cores a machine has. And you really don't want any, and specially not a high number of, blocked processes on a live server. |
b
|
Processes | Processes that are blocked in uninterruptible sleep. You want this to be as low as possible. | |
swpd
|
Memory | How much memory has been paged to swap (Virtual memory). Consider adding more memory and/or enabling zswap if this number is high. | |
free
|
Memory | How much idle memory is available. This is not the same as usable memory available to new programs (grep MemAvailable /proc/meminfo, this value shows how much memory is completely idle (not used for file caching or anything else)
| |
buff
|
Memory | How may memory is used for buffering | |
cache
|
Memory | The amount of memory used to cache files and other objects. This memory is free as far as applications are concerned, it will be freed up if a program needs it. | |
si
|
swap | Swap In, memory being moved from swap to RAM. | High values for si and so indicate that you have too little memory for what your machine is doing.
|
so
|
swap | Swap Out, memory being moved from RAM to swap. | |
bi
|
IO | Blocks read from block devices (SSDs/HDDs/etc). | A machine with constantly high bi and bo will benefit from faster disk storage devices. You may also want to look into why there are so many disk reads and writes. It is natural if it is a file server, it is not if it is a web server.
|
bo
|
IO | Blocks read from block devices (SSDs/HDDs/etc). | |
in
|
System | The number of interrupts per second, including the clock. | |
cs
|
System | The number of context switches per second. | |
us
|
CPU | Percentage of all CPU time spent running user (non-kernel) code | Consider replacing the CPU or upgrading if these values, other than id, are constantly close to 100%
|
sy
|
CPU | Percentage of all CPU time running kernel (system) code. | |
id
|
CPU | How much time, in percent, the processor is idle. This does include time the CPU is idle because it is waiting for I/O. | It is generally good that a CPU spends much time idle (id, that means there are CPU resources available when they are needed. It is bad if a CPU is idle because it is waiting for IO (wa and si, so, bi or bo are high at the same time)
|
wa
|
CPU | Percentage of CPU time spent waiting for I/O | |
st
|
CPU | CPU time stolen from a virtual machine. Only relevant if you use virtualization, otherwise it is always zero. |
vmstat can, additionally, provide two other columns that are not shown by the default system monitoring output:
| Switch | Statistic | Type | Description | Note |
|---|---|---|---|---|
-a
|
inact
|
Memory | Shows how much memory is inactive | Replaces buff
|
-a
|
active
|
Memory | Shows how much memory is active | Replaces cache
|
SSD/HDD statistics
vmstat -d X where X is a value in seconds can be used to monitor disk activity. The output is similar to what iostat provides but it is not as pretty and it does not support showing colorized output.
vmstat -d 2 will show something similar to:
disk- ------------reads------------ ------------writes----------- -----IO------
       total merged sectors      ms  total merged sectors      ms    cur    sec
sda   880862    353 102880648  729246 559281693 6862356 25668756895 1308202226      0 122526
sdb    77534   3452 10002679   84576 559287692 7054931 25670345543 1361943932      0 123599
md1   950064      0 112467239       0 494355988      0 25559422423       0      0      0
md0     3356      0  323084       0   3656      0 2025390       0      0      0
sda   880862    353 102880648  729246 559282275 6862356 25668763598 1308206201      0 122526
sdb    77534   3452 10002679   84576 559288277 7054931 25670352278 1361948260      0 123599
md1   950064      0 112467239       0 494355993      0 25559423839       0      0      0
md0     3356      0  323084       0   3656      0 2025390       0      0      0
sda   880862    353 102880648  729246 559282290 6862356 25668763696 1308206210      0 122526
sdb    77534   3452 10002679   84576 559288292 7054931 25670352376 1361948269      0 123599
While vmstat -d does provide disk statistics it is absolutely not the best tool for that particular purpose. You can use it but you are better off using iostat, which is prettier and support for colorized output, if you are only interested in information about disk activity. vmstat is great if you want a brief picture of everything that is going on but it is not the best tool for this particular purpose.
Disk partitions
vmstat can be used to monitor reads, read sectors, writes and requested writes on specific disk partitions. More disk-focused monitoring utilities like iostat are more useful for this purpose. You can use vmstat to monitor specific disk partitions by adding -p /dev/partition (and preferably a value in seconds) as long as it is a "real" partition. vmstat -p /dev/md0 2 (where md0 is a RAID partition) will simply not work but vmstat -p /dev/sda1 2 will.
Enable comment auto-refresher
Anonymous (9ab9b21677)
Permalink |